Mobile Navigation

  • National
    • Policy
      • High Expectations
      • Quality Choices
      • Personalized Pathways
    • Research
    • Commentary
      • Gadfly Newsletter
      • Flypaper Blog
    • Events
    • Scholars Program
  • Ohio
    • Policy
      • Priorities
      • Media & Testimony
    • Research
    • Commentary
      • Ohio Education Gadfly Biweekly
      • Ohio Gadfly Daily
  • Charter Authorizing
    • Application
    • Sponsored Schools
    • Resources
  • About
    • Mission
    • Board
    • Staff
    • Career
Home
Home
Advancing Educational Excellence

Main Navigation

  • National
  • Ohio
  • Charter Authorizing
  • About

Ohio Menu

  • Topics
    • Accountability & Testing
    • Advanced Education
    • Career & Technical Education
    • Charter Schools
    • Curriculum & Instruction
    • ESSA
    • Evidence-Based Learning
    • Governance
    • Personalized Learning
    • Private School Choice
    • School Finance
    • Standards
    • Teachers & School Leaders
  • Research
  • Policy
  • Commentary
    • Ohio Gadfly Newsletter
    • Ohio Gadfly Blog
    • Events

The Education Gadfly Weekly

Sign Up to Receive Fordham Updates

We'll send you quality research, commentary, analysis, and news on the education issues you care about.
Thank you for signing up!
Please check your email to confirm the subscription.

Ohio Gadfly—How Texas makes teacher merit pay work

Volume 19, Number 18
8.25.2025
8.25.2025

Ohio Gadfly—How Texas makes teacher merit pay work

Volume 19, Number 18
view
Texas teacher merit pay plan blog image
School Funding

An in-depth look at how Texas makes teacher merit pay work

We take a look at the Teacher Incentive Allotment. Started in 2019 in Texas, TIA provides some great examples of how Ohio could implement a statewide performance pay program for teachers.

Jessica Poiner 8.25.2025
OhioOhio Gadfly Daily

An in-depth look at how Texas makes teacher merit pay work

Jessica Poiner
8.25.2025
Ohio Gadfly Daily

Ohio schools should stop handing out bonuses for master’s degrees

Aaron Churchill
9.2.2025
Ohio Gadfly Daily

Ohio’s early literacy to-do list should include mandatory retention and intervention

Jessica Poiner
9.2.2025
Ohio Gadfly Daily

Analyzing the effectiveness of summer school programming conducted in 2022

Jeff Murray
9.2.2025
Ohio Gadfly Daily

The factors influencing private school choice enrollment

Jeff Murray
8.28.2025
Flypaper
view
Masters degrees blog image

Ohio schools should stop handing out bonuses for master’s degrees

Aaron Churchill 9.2.2025
Ohio Gadfly Daily
view
OH early literacy to do list blog image

Ohio’s early literacy to-do list should include mandatory retention and intervention

Jessica Poiner 9.2.2025
Ohio Gadfly Daily
view
Summer school SR image

Analyzing the effectiveness of summer school programming conducted in 2022

Jeff Murray 9.2.2025
Ohio Gadfly Daily
view
Students entering a school

The factors influencing private school choice enrollment

Jeff Murray 8.28.2025
Flypaper
view
Texas teacher merit pay plan blog image

An in-depth look at how Texas makes teacher merit pay work

Jessica Poiner
8.25.2025
Ohio Gadfly Daily

After years of being a third rail, teacher merit pay is slowly making its way back to the forefront of education policy debates. At first glance, it seems like a pretty simple idea. Studies show that, when it comes to improving student achievement, teachers matter more than any other element of schooling. Moreover, teaching can be a difficult and stressful job. If effective teaching is incredibly important and incredibly difficult, those who are highly-effective should be rewarded for their efforts and skill—especially when they work in high-need schools. There’s also research demonstrating that merit pay programs are associated with a statistically significant increase in student test scores and that they have the potential to decrease teacher turnover and increase recruitment.

It’s no wonder, then, that advocates and political leaders are showing interest. But implementing merit pay in schools is tricky business. The same research that points to the benefits of merit pay programs also finds that their success largely depends on design and context. If policymakers don’t get the details right, they could be plowing full steam ahead toward a policy shipwreck.

One way Ohio could navigate these tricky waters is to emulate states that have already successfully done so. Texas is a prime example. The Lone Star State began implementing a statewide teacher performance pay program known as the Teacher Incentive Allotment (TIA) in 2019. The initiative is designed to offer top teachers “an accessible pathway to a six-figure salary” and help districts attract and retain high-performers. TIA gives districts and open-enrollment charter schools the option to create and use a local designation system to identify top educators and label them as “Recognized,” “Exemplary,” or “Master” teachers for a five-year period. Employing designated teachers generates additional state funding for participating districts, as they receive an annual allotment based on a teacher’s designation level. Greater funding is available for those who work at high-needs or rural campuses.

Since its inception, participation in TIA has grown exponentially. According to the 2023–24 TIA annual report, there were only thirty-three participating systems during the 2018–19 school year. By 2024–25, participation had shot up to a whopping 597—nearly half of the districts in Texas. Teachers’ views on tying pay to classroom effectiveness also improved over time, moving from 56 percent being supportive in 2022 to 62 percent in 2024. Moreover, TIA appears to be having a positive impact on teacher retention efforts. Retention rates for TIA identified teachers remaining in the same district in a teaching role from the 2022–23 to the 2023–24 school year was 88.5 percent, compared to 80.4 percent for non-identified teachers.

The annual report doesn’t offer in-depth data on student outcomes. But TIA designations are directly tied to individual student growth data (more on this later). This means the teachers who are being rewarded with higher pay—and are more likely to be retained by their districts in teaching roles as a result—are those who have demonstrated their effectiveness according to a student growth measure. (Roughly 10 percent of teachers in participating districts have been identified.)

But how, exactly, does TIA work? Let’s take a closer look at three key aspects of the program: local designation systems, the application process, and funding.

Local designation systems

The cornerstone of TIA is local designation systems. Districts have the flexibility to design their own unique systems to align with local goals for retention, recruitment, and staffing. But every system is required to include or address three main components.

1. Eligibility
Districts can make all teachers eligible or choose which teaching assignments and campuses qualify. They can also establish local eligibility prerequisites, such as mentoring, years of experience, attendance, or campus leadership roles.[1]

2. Teacher performance data and designation criteria
Teacher performance data consist of classroom observations, student growth, and any additional components a district may choose to include (like results from student and parent surveys or teacher attendance). TIA requires the observation component to amount to at least 45 minutes of instructional time, and all teachers must be evaluated using an approved rubric. Meanwhile, to meet the requirement for a valid and reliable student growth measure, districts can choose from four options: student learning objectives, pre- and post-tests that include expected growth targets (like nationally norm-referenced exams), portfolios, or value-added models. It’s important to note that districts must establish growth targets at the individual student level. The state requires this for two reasons: One, it ensures districts measure a teacher’s impact on all students; and two, it makes designation accessible to all effective teachers, regardless of student demographics.

Designation criteria refers to the process a district uses to determine which teachers[2] are assigned to the three performance levels of Recognized, Exemplary, and Master. Teachers with National Board Certification can be identified as Recognized, and districts that employ them can receive TIA funds, even without a local system in place. The Texas Education Agency (TEA) does not choose which teachers qualify, nor does it reject individual teacher designations. But TIA does have performance standards for teacher observation and student growth ratings at each designation level that were established using statewide teacher performance data. Each level represents teacher performance relative to all Texas teachers: Recognized designations represent the top 33 percent, Exemplary the top 20 percent, and Master the top 5 percent. Prior to approving local systems, the department closely examines districts’ overall alignment to those standards, but exact alignment is not required. The TIA Guidebook provides a more detailed look at the statewide performance standards for both teacher observation and student growth.

3. TIA spending plan
Districts are required to develop a local spending plan, and state law details how they can spend their allotted funds. At least 90 percent of the allotment must be spent on teacher compensation at the campus where the identified teacher works. Allowable uses include stipends or salary increases for designated teachers, stipends or salary increases for other teachers at the same campus (like classroom inclusion teachers), and benefits and retirement contributions. These funds cannot be used to compensate school leaders, non-instructional staff, central office staff, or staff who work at a different campus. Up to 10 percent may be used to support the local system or to assist teachers in earning designations. Allowable spending includes professional development for teachers, TIA assessment costs, and recruitment efforts like job fairs. These funds cannot be spent on general administrative expenses.

Application process

The TIA Guidebook offers an in-depth look at all the various steps a district must take to participate in TIA. Before the application process officially begins, districts design their local system. They do so by selecting one or more “TIA Leads” to drive the system design process, coordinate with staff and stakeholders, complete the application, and oversee implementation. Support is available through regional education service centers, technical assistance providers, and TEA.

Once a district has designed its system, it goes through a three-year application and approval process. During year one—the application year—district officials attend technical assistance sessions and submit their formal application. Year two, the “data capture” year, is when districts implement their systems and collect teacher performance data. Districts are also required to administer the TIA Teacher Buy-In Survey, developed by Texas Tech University, at the beginning of year two to gauge teachers’ understanding and degree of support for their district’s system. Then, in the fall and winter of year three, districts submit teacher designations and performance data to Texas Tech for validation. TEA conducts a final holistic review of the system, and allotments are awarded once a district receives state approval.

Funding

TIA is an allotment—not a grant program—included within the state’s school funding system, making it a steady and sustainable funding source for schools. The allotment formula is complex, comprising a base allotment (the minimum amount that a designated teacher generates), a multiplier rate (additional funding allocated to teachers who work at high-needs or rural campuses), and an average campus student point value (calculated from a campus’ socioeconomic and rural status). Funding levels range from $3,000–9,000 for Recognized teachers, $6,000–18,000 for Exemplary teachers, and $12,000–32,000 for Master teachers. There is no cap on TIA allotment funds or the number of teachers who can earn a designation. And because districts receive larger funding amounts when identified teachers work in high-need schools, TIA incentivizes the state’s best teachers to work in the schools that need them most. According to the most recent TIA annual report, the total allotment payout for the 597 districts participating during the 2024–25 school year was $292 million.

***

Teacher merit and incentive pay has a long history of controversy and pushback, including in Ohio. Much of this pushback can be attributed to valid questions about how to design programs to ensure they’re fair and effective. Texas offers Ohio an intriguing example of what’s possible, as TIA has proven to be popular with both districts and teachers while successfully boosting retention. But if Ohio leaders want to implement a similar program here, there are some big questions they’ll have to answer. Stay tuned for a closer look at some lessons that Ohio can learn from Texas.  


[1] These prerequisites may exclude teachers from designation consideration even if their performance otherwise qualifies them.

[2] “Teachers” is defined as student-facing instructional staff. This can include instructional aides and paraprofessionals, classroom inclusion support teachers, and other staff who primarily work directly with students in an instructional setting.

view
Masters degrees blog image

Ohio schools should stop handing out bonuses for master’s degrees

Aaron Churchill
9.2.2025
Ohio Gadfly Daily

Despite record-breaking funding levels, many Ohio districts are worried about a looming budget crunch. News reports from Cincinnati, Cleveland, Columbus, and elsewhere have detailed efforts to slim down budgets—belt tightening that is necessary as federal Covid-relief dollars have dried up and state and local funds aren’t likely to be as copious as in recent years.

As schools head into more uncertain fiscal times, school officials should look to stretch the school dollar in ways that keep student achievement heading in the right direction. In districts shedding enrollment, one possibility is to close underutilized schools—a money saver that can also benefit students if they transfer to a higher-performing school. Other options include sharing services or even hiring high school students for custodial or food service jobs. (For more ideas, Texas has an inventory of 101 commonsense ways to reduce expenses.)

Trimming here and there can certainly help, but it doesn’t tackle the largest educational expense of all: teacher compensation. Here, there is much school districts could do to address costs, all while putting the teacher-pay portion of the budget to better use. One strategy, which doesn’t entail workforce reductions or jeopardizing achievement, is to tackle the pay premiums that teachers automatically receive just for having a master’s degree.

Now, to some, paying extra for a graduate degree doesn’t sound so bad. And it wouldn’t be such a terrible idea if the credential were a proxy for classroom effectiveness. But research has found no link between effectiveness and a master’s degree. In other words, teachers with master’s degrees are no more likely to improve student achievement than those with a bachelor’s. Moreover, as a recent study from the National Council on Teacher Quality (NCTQ) reminds us, these pay bumps are expensive. Based on an analysis of 135 U.S. districts, NCTQ estimates that they spend almost a half-billion dollars extra each year for teachers with master’s degrees. This doesn’t even count the tuition costs that educators bear to obtain these degrees (or in some cases, that districts reimburse).

And yet Ohio districts—following a mandate in state law—continue to pay more for master’s degrees. Here’s what it looks like in Columbus City Schools. As the table below indicates, seniority automatically generates a higher salary. But then, moving to the degree columns, we also notice that teachers with a master’s degree receive significantly higher pay. For instance, a teacher with ten years of service and a master’s degree receives $80,940, while her bachelor’s degree counterpart receives just $72,990. Despite their likelihood of being equally effective, Columbus pays master’s degree teachers 10.9 percent more at the various seniority levels.

Table 1: Columbus City Schools’ teacher salary schedule

Masters degree blog image table 1
Note: Columbus City Schools’ full salary schedule for 2024–25 is available here.

Ohio should put a fork in the ineffective and costly practice of paying teachers more for master’s degrees. It does absolutely nothing to advance student learning. It encourages teachers to sit through even more coursework, likely taking night classes or clicking through online modules, all while paying tuition or accumulating student debt. This approach is expensive for districts and taxpayers, as 62 percent of Ohio teachers (following the salary incentive) do indeed possess a master’s degree. And it soaks up money that could be directed to more productive ends, such as providing extra pay to teachers who are doing the most for students.  

State lawmakers should do their part to discontinue this practice by repealing the requirement that districts adopt salary schedules based on seniority and degrees earned. They could even take it a step further, as North Carolina has done, and expressly prohibit districts from paying extra for master’s degrees. Enterprising district leaders need not wait for legislative action, either, as they can work to minimize the impact of the state regulation by reducing their pay premiums.[1] For instance, rather than giving master’s degrees a 10.9 percent bump, Columbus could reduce it to 2 percent. To avoid substantial near-term pay cuts, such a reduction may need to be phased in over time. But it would allow a district to transition from a credentials-based system to one that compensates teachers more strategically.

The way that Ohio school districts pay teachers—and the state laws that institutionalize these practices—urgently needs reform. These archaic compensation systems reward seniority and credentials, things that have not been proven to move the achievement needle. To drive higher student outcomes, particularly at a time of tightening budgets, schools will need compensation systems with a laser focus on teacher excellence. By prizing educator talent, skill, and accomplishment—not paper credentials and seniority—merit-based pay systems will help more Ohio students achieve their potential.


[1] There is no prescription on what the master’s premium over a bachelor’s salary must be, so long as the master’s degree salaries remain above the statewide minimum salary schedule.

view
OH early literacy to do list blog image

Ohio’s early literacy to-do list should include mandatory retention and intervention

Jessica Poiner
9.2.2025
Ohio Gadfly Daily

If you follow education policy in the Buckeye State, the idea of an early literacy to-do list probably seems strange. It’s only been two years since Governor DeWine and the General Assembly established a statewide initiative focused on the science of reading. By focusing on effective instructional practices that have been proven to work for students of all reading levels, the initiative promises to raise literacy achievement across the board.

But a comprehensive literacy strategy, like the ones that have greatly benefitted students in Florida and Mississippi, also includes intensive interventions for students who are falling far behind. In this area, Ohio still has work to do. Let’s examine two ideas that Ohio lawmakers should consider in an effort to provide extra support to the students who need it most.  

1. Reinstate the original third grade retention requirement

Lawmakers should be familiar with the concept of retaining struggling readers, as Ohio’s Third Grade Reading Guarantee has been the law of the land for more than a decade. The guarantee, a package of early literacy reforms passed during the Kasich era, aims to ensure that all children have the foundational reading skills they need to succeed. Its cornerstone is a requirement for schools to retain students who are still struggling to read fluently at the end of third grade and provide them with intensive interventions before promoting them to fourth.

Or at least that was the cornerstone. In response to political pressure from the education establishment, lawmakers gutted the retention requirement in 2023. Technically, struggling readers can still be retained. But state law now includes a significant loophole that allows schools to avoid retention if parents request promotion. Unsurprisingly, report card data indicate that, after the new policy went into effect, virtually every third grader in Ohio—regardless of their reading skill—was promoted.

Bowing to adult priorities rather than holding the line is a bad look for lawmakers, and it’s not good for kids. In a well-known 2011 study, the Annie E. Casey Foundation found that non-proficient readers in third grade are four times more likely to drop out of high school than their proficiently reading peers. This clearly demonstrated that failing to intervene early has serious long-term consequences for students and helped prompt Ohio’s guarantee in the first place. Meanwhile, rigorous studies published since that landmark report have evaluated states’ third grade retention policies. All of them—including one from Ohio, as well as Florida, Indiana, and Mississippi—have found that the policy significantly boosts the achievement of retained pupils. The upshot? If state lawmakers want to ensure that Ohio’s science of reading initiative reaches its full potential, they need to reinstate a firm retention policy to prevent students from falling through the cracks.

2. Expanding intervention to struggling readers in all grades

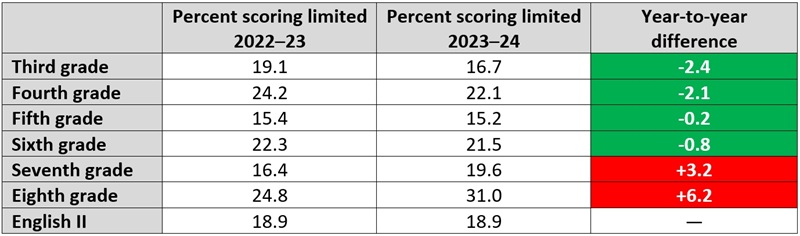
When students take Ohio’s state exams, their results fall into one of five performance levels: limited, basic, proficient, accomplished, and advanced. The top three levels (proficient, accomplished, and advanced) are considered passing scores. But data from the two most recent school years show that a sizable percentage of Ohio’s students are scoring at the limited level in reading.

Chart 1 shows that the number of students in grades 3–8 who scored limited in the last two years ranges from 15 to 31 percent. Things aren’t much better in high school, where nearly 19 percent of students scored limited on the English II end-of-course exam. It’s good news that, in the earlier grades, the number of students scoring limited decreased between 2023 and 2024. But in seventh and eighth grades, the number is rising.

Chart 1. Percentage of students scoring limited on English language arts state tests

OH early literacy to do list blog chart 1

To their credit, lawmakers are considering ways to intervene with struggling students. Senate Bill 19 would require public schools to provide academic intervention services to students who score limited on reading or math state tests. Given the percentage of students who fall into this category—not only in reading, but also in math—lawmakers would be wise to get these provisions into law as soon as possible.

***

With Ohio’s science of reading initiative, state lawmakers established a solid foundation for reading improvement. Building on that foundation is the next step. Reinstating retention and ensuring low-scoring students are provided with intensive intervention could bolster the likelihood that Ohio’s early literacy efforts are successful for all students.

view
Summer school SR image

Analyzing the effectiveness of summer school programming conducted in 2022

Jeff Murray
9.2.2025
Ohio Gadfly Daily

More than 70 percent of school districts nationwide reported expanding their summer school programming in 2022, mostly using federal ESSER funds, in one of many efforts to mitigate pandemic-era learning loss. A new study published in the American Educational Research Journal provides the first large-scale evaluation of the effectiveness of that programming.

The 14-strong research team estimates the effect of summer school on learning loss recovery by tracking the academic progress of students who attended programs in the summer of 2022 across eight school districts participating in the Center for Education Policy Research’s Road to Recovery project. The districts were mostly large and urban (including Dallas, Tulsa, and one that remains anonymous in the report), with a total enrollment of about 400,000. They served higher percentages of Black and Latino students (56 percent) and students eligible for free and reduced-price lunch (55 percent) than the national average (33 and 45 percent, respectively). Based on the Education Recovery Scorecard, all had seen sharp decline in math and reading test scores between 2019 and 2020, with varying levels of recovery seen through the end of the 2021–22 school year. On average, the remaining learning loss was approximately 0.19 standard deviations (SD) in math and 0.02 SD in reading, both higher than the national average (0.15 and 0.09 SD, respectively).

Their analytic sample comprises nearly 130,000 students expected to enter grades one through eight in the fall of 2022 and who had NWEA MAP Growth scores in reading and math for both the spring and fall 2022 test administrations. Using value-added models that control for students’ demographics and prior achievement, the research team estimated an overall, though small, positive effect of summer school on math test achievement in all eight districts, ranging from 0.03 to 0.04 SD. The longer students attended (hours and days), the higher the positive impact. However, since attendance was estimated at just 13 percent of K-8 students per district, summer school participation was estimated to have remediated a mere 2 percent of the districts’ loss in math. To add to the bad news, only two districts saw statistically significant impacts on reading test achievement, with the others—and the overall impact—statistically indistinguishable from zero. There was very little variation in impact among subgroups of students, as well. Even worse: Some of the districts actually combined summer programming with tutoring—to no better effect than summer school alone in either math or reading.

Interestingly, these uniformly unimpressive outcomes result from eight disparate efforts, with many permutations of scheduling, duration, content, staffing, and student recruitment across districts and, one assumes, even across different schools in the same district. This report goes into a little detail on matters of implementation in the specific study districts, but one member of the research team has previously conducted a much deeper analysis of Covid recovery programing in four anonymous Road to Recovery districts. Challenges cited there include reaching the neediest students, maintaining student attendance, finding adequate and effective staff, and a lack of central office support for out-of-school-time programming. These speedbumps, similar to those noted in this report, would seem to be universal across districts, schools, and intervention types, as a new and “sobering” analysis of tutoring impacts has also shown.

It seems clear now that recovery from Covid-era learning loss was never going to happen quickly—despite money[1], good intention, and effort—and 2022 was far too soon to see it. At least some states and schools appear to be making headway in more recent years, even if it is too late for the millions of impacted students who have already finished school in the interim.

SOURCE: Ian Callen et al., “Summer School as a Learning Loss Recovery Strategy After COVID-19: Evidence from Summer 2022,” American Educational Research Journal (July 2025).


[1] There is no discussion of the cost of providing summer school in the paper. Analysis of ROI—which some research shows can be high for summer programming—would add some nuance to these generally lackluster findings.

view
Students entering a school

The factors influencing private school choice enrollment

Jeff Murray
8.28.2025
Flypaper

As private school choice policies have proliferated and matured across the country, researchers have looked at the policy side of the process, as well as outcomes for participants and competitive effects on district schools. A new analysis from EdChoice looks at the design and implementation phase, which has been less studied but certainly affects student enrollment as well as school participation.

Analysts Misty Gallo, Colyn Ritter, and Patrick Wolf compiled a near-comprehensive list of private school choice programs from Vermont’s Town Tuitioning Program, established in 1869, to Arizona’s Educational Freedom Account Program established in early 2024—a total of 65 programs comprising standard education savings accounts (ESAs), school vouchers, tax-credit-based ESAs, tax-credit scholarships, and refundable tax-credit programs. They excluded any plans that merely offered a non-refundable individual tax credit/deduction and any that were enacted after March 2024.

They posit two groups of factors that are likely to influence enrollment rates. First is a set of eight program features (which any given program may or may not include): some that are “additive” to the programs (providing transportation to a choice school and allowing private school students to access extracurriculars at their public school, for example), some that serve to limit eligibility (such as IEP status and income limits), state level capacity features (such as total funding caps and enrollment limits), and regulatory features like testing requirements specific to choice-using students. Second is a set of eight statewide factors that indicate the health and quality of public schools and could serve to influence families’ motivation to exercise a non-district choice when it arises: school bullying rates, average NAEP scores in both fourth and eighth grade, levels of parental school choice support (as determined by survey data), poverty rate in public schools, number of participating private schools in a program, a school funding “fairness” grade per state (determined annually by the American Legislative Exchange Council and used here as a proxy for funding support for school choice), and which political party controls legislative and executive branches (a proxy for school choice support at the level of state policy).

In their initial analysis—looking at statewide factors only—the researchers find that levels of school bullying, average NAEP scores, and levels of school choice support are all significant predictors of take-up rates for private school choice programs. These operate in the expected directions for students in year one, year two, or year five after program establishment (the specific time points under examination throughout the report). Bullying rates are the most consistent of these, being highly significant in all benchmark years. Average eighth grade NAEP scores demonstrate a significant association with take-up rates in years two and five, with lower achievement levels predicting increased use of private school choice, as expected. Average fourth grade NAEP scores, however, are positively associated with take-up rates only in year two. All together, these handful of statewide factors seem to be reasonably strong drivers compelling families toward a non-district education choice.

Program features paint a less clear picture, with weak or null significance for most of them, including transportation, requiring a student have an IEP, and requiring accountability testing. Indeed, the analysts actually found negative impacts on enrollment for some factors—including allowing program participants to remain eligible for extracurriculars at their district school, which was expected to boost enrollment but did the opposite in year one across the range of programs that included this facet. The report includes additional breakouts of the results, including by region of the country and by various subsets of the student population in specific states.

This research has a number of limitations, especially on the supply side of the equation. “Number of schools participating,” for example, is an imperfect proxy for availability, especially in ESA-type programs where vendors could just as easily be schools with limited capacity as they could be virtual tutoring companies with no cap on users. It is also noteworthy that an analysis looking at the potential influence of program design features didn’t bother to break out the findings by program type (e.g. ESAs versus tuition vouchers). Nonetheless, the story generally appears to be that the state of public education primarily drives parents to enroll their students in private school choice programs. This tends to reinforce previous research findings that school safety, here measured by rates of bullying, is at the top of their list.

SOURCE: Misty Gallo, Colyn Ritter, and Patrick J. Wolf, “If You Build It This Way, They Will Come,” EdChoice (July 2025).

Fordham Logo

© 2026 The Thomas B. Fordham Institute
Privacy Policy
Usage Agreement

National

P.O. Box 110
Burke, VA 22009

202.223.5452

[email protected]

Ohio

P.O. Box 82291
Columbus, OH 43202

614.223.1580

[email protected]

Sponsorship

130 West Second Street, Suite 410
Dayton, Ohio 45402

937.227.3368

[email protected]