Ohio is in its early literacy era. Last year, policymakers established a statewide science of reading initiative that champions high-quality instructional materials and professional development for teachers. To support this effort, legislators set aside approximately $169 million.
Ohio is in its early literacy era. Last year, policymakers established a statewide science of reading initiative that champions high-quality instructional materials and professional development for teachers. To support this effort, legislators set aside approximately $169 million. And just last month, Governor DeWine announced that the U.S. Department of Education had awarded Ohio a $60 million grant that will provide further help with implementation.
Advocates and families should feel good about these reforms. But that doesn’t mean policymakers can rest on their laurels. Establishing an initiative is only half the battle. The other half—faithful implementation and making data-driven tweaks as needed—is equally important. For clues about how to do this well, policymakers can look to states that are further along in their efforts. Mississippiand Florida are obvious choices, given their track record of success. But when it comes to data tracking and transparency, there’s another state worthy of attention: Colorado.
Colorado’s early literacy efforts began in 2012, when lawmakers enacted the Colorado Reading to Ensure Academic Development Act (READ Act). Much like Ohio’s Third Grade Reading Guarantee, which was also established in 2012, the READ Act required schools to administer reading assessments to incoming kindergarteners and develop an individualized plan for students identified with significant reading deficiencies (SRD). Colorado also allocated per-pupil intervention funds to support implementation, with an annual appropriation of approximately $38 million.
In 2019, Colorado leaders updated the READ Act to address several issues they believed were keeping the legislation from having its desired impact. Improving data tracking and transparency were part of those efforts. In fact, the state has a robust dashboard dedicated to READ Act data. Let’s take a closer look at two of its features.
READ Data Dashboard
As part of the READ Act, districts are required to report specific data to the Colorado Department of Education (CDE) to determine the number of students identified with SRD and their progress. These data have been assembled into a detailed dashboard organized under three tabs.
The state-level data tab identifies the number of students designated as having SRD over the last five years.[1] It identifies the statewide SRD rate as a percentage and disaggregates SRD identification rates by race and ethnicity, gender, grade level, and other demographics, including students with an IEP, students eligible for free and reduced-price lunch, and two categories of English learners.
The district-level data tab allows stakeholders to access SRD data for specific districts during the five most recent academic years and filter results by the aforementioned student groups.
The financial data tab tracks per-pupil intervention funding provided by the READ Act. It enables stakeholders to determine how much each district received during the last five years and includes an indicator of year-to-year percentage changes.
Literacy Curriculum Transparency Dashboard
Under the READ Act, schools must use evidence-based core, supplemental, and intervention reading instructional programs.[2] The Literacy Curriculum Transparency Act took this provision a step further by requiring districts to submit to CDE which core, supplemental, and intervention programs are used in each of their schools. The state must post this information on its website and does so via the Literacy Curriculum Transparency Dashboard. This dashboard is organized into three tabs, with each tab focused on either core, supplemental, or intervention programming. Under each one, stakeholders can access data on the programming used at the state, district, and school level, and can filter by academic year and grade level. For example, in Denver during the 2023–24 school year, the district’s most used core literacy program was Amplify CKLA. It was used in roughly 70 percent of schools in each grade, K–3.
***
Like Colorado, Ohio has invested significant time, effort, and funding into improving early literacy outcomes. But right now, Ohio doesn’t have a dedicated mechanism for tracking improvement and implementation. The early literacy component on state report cards is certainly helpful in keeping tabs on student outcomes. But Ohio can and should do more to transparently track its early literacy efforts. Colorado’s detailed and publicly-available data dashboards offer a promising model for doing so.
[1] There are no data presented for the 2019–20 school year due to the pandemic.
[2] CDE was tasked with identifying evidence-based instructional programs that districts can use READ Act funds to purchase, but districts are not required to select programming from the CDE advisory list. They are permitted to use other funding streams to purchase scientifically-based reading programs that aren’t included on the state list.
In fall 2014, Ohio introduced a report card element that gauged how well-prepared students are for college and career. Known as Prepared for Success, this component aimed to go beyond basic graduation rates to look at more rigorous gauges of post-secondary readiness.
There was and continues to be a need for such a report card measure. Due to the relative ease of meeting diploma requirements, graduation rates have become a less reliable measure of readiness. Based on ACT/SAT data and Ohio’s remediation-free standards, we know that fewer than one in four of students have the full academic preparation needed for college coursework. Less than one in ten high school students have historically completed an industry credentials program. Yet graduation rates have consistently exceeded 80 percent statewide.
In the most recent revision of the report card, state lawmakers made significant changes to Prepared for Success. They first of all changed its title to College, Career, Workforce, and Military Readiness (CCWMR), which reflects updates that happened under the hood. The legislature created six additional ways that students can demonstrate readiness, including military enlistment or completing an apprenticeship. These options were added to the five existing readiness indicators, which include achieving college remediation-free scores or earning industry credentials.
Because of these changes, along with new data requirements, legislators held off on making CCWMR a rated element and incorporating results into high schools’ overall ratings. Consistent with statute, the Ohio Department of Education and Workforce (DEW) has for the past few years reported data for the measures included in CCWMR—including numbers used in this piece—but just haven’t assigned component ratings. Lawmakers, however, included provisions that require DEW to propose rules for making it a rated component, which must then be approved by a legislative committee known as JCARR.
Last week, DEW released proposed rules for implementing CCWMR. The agency wisely calls for CCWMR to be a rated element starting in 2024–25, and to be factored into overall ratings. Fully incorporating the component into the report card will signal to parents and communities the importance of readying young people for college and career. It also incentivizes schools to work to ensure that all students meet state goals for readiness.
So far so good, but as policy wonks often note, the devil’s in the details. There remain some technical issues that policymakers need to address to ensure the rigor of this component. They include the CCWMR grading scale, how annual improvement is calculated, and the rigor of the underlying measures. How these issues are handled could make or break the component, and the rest of this piece discusses each of them in turn.
Grading scale
The DEW rules propose a grading scale for CCWMR—a necessary step for implementing it as a rated component. The design of this scale is critical, as it sets the targets and expectations for schools. On the one hand, the scale should establish ambitious performance goals and meaningfully differentiate schools, both recognizing excellence and flagging underperformance. On the other hand, the scale should also set targets that are achievable and consistent with the available data. A balanced approach—one that is both rigorous and realistic—is most likely to drive improved student preparedness.
The DEW rules propose the following scale for CCWMR: To receive a five-star rating, a school must have a post-secondary readiness rate of at least 80 percent; four stars = 70–80 percent; three stars = 60–70 percent; two stars = 50–60 percent; and one star = 0–50 percent. The readiness rate refers to the percentage of a school’s four-year graduation cohort who meet at least one of the eleven readiness indicators within CCWMR.
At first glance, this framework—and the ratings that it would yield based on 2023–24 data—seems sensible. At a district level, figure 1 shows that the most frequent rating is a three-star rating, with roughly equal numbers of districts in the one- and two-star categories as are in the four- and five-star categories (this chart doesn’t account for the improvement element discussed later).
Figure 1: CCWMR ratings with no improvement dimension based on districts’ 2023–24 readiness rates
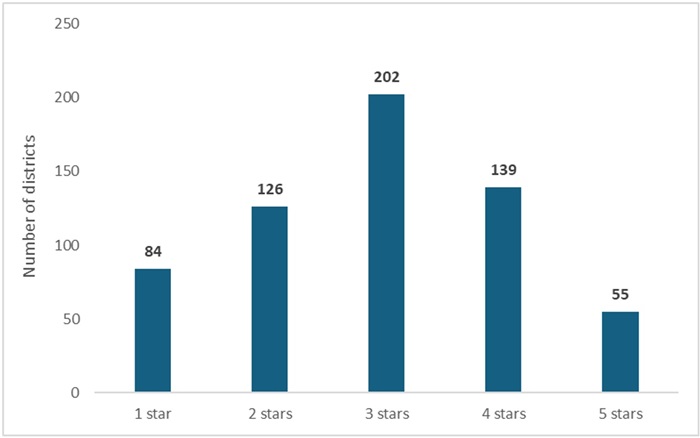
This baseline model, however, does not consider that readiness rates are likely to rise in the future. We’ve already seen a remarkable increase in this rate from 2022–23 to 2023–24, as the median district CCWMR readiness rate rose from 43 to 65 percent. Further increases are likely as schools pay more attention to these measures—some of which are new to the report card system—and reporting improves. Schools are also likely to respond to the report-card incentive and more strongly encourage students to meet one of the eleven indicators. If rates continue to rise, the ratings distribution will shift rightward—more districts receiving higher ratings—as the proposed grading scale remains fixed.
Recommendation: To account for likely increases in readiness rates, DEW should raise the CCWMR performance targets across the board. We propose a slightly more challenging grading scale of five stars = 85–100 percent; 4 stars = 75–85 percent; 3 stars = 65–75 percent; 2 stars = 55–65 percent; 1 star = 0–55 percent. In a few years, policymakers should also revisit the CCWMR grading scale to ensure its rigor as the data becomes more settled.
Annual improvement
Under state law, there is also an “improvement” element that must be taken into account. This provision stipulates that districts must receive at least a three-star CCWMR rating if they achieve a certain level of improvement in readiness rates (as determined by the DEW). The idea here is to incentivize districts to improve, even if they have low baseline rates. The precise improvement target isn’t defined in statute, nor is it established in the proposed rules. However, this provision should not be overlooked, as it could well have a significant impact on the rating distribution.
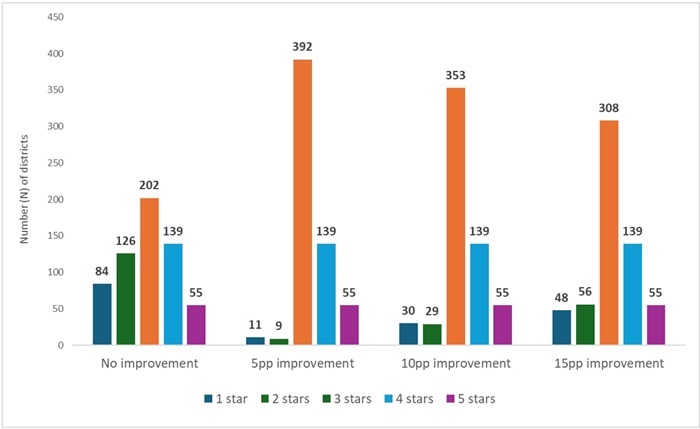
Figure 2 shows how the CCWMR ratings would change, depending on the improvement standard. If DEW were to set an improvement standard of 5 percentage points,[1] nearly all one- and two-star districts would get a bump to three stars. Thus, we see a large shift into the three-star category, and 392 out 606 districts would receive that rating. Even under more stringent standards of 10 and 15 percentage-point increases, large numbers of districts still move from the one- and two-star categories into the three-star category. These projections are meant to illustrate that—if the improvement bar is set too low—this provision could substantially reduce the number of low-rated districts. That would undermine the rigor of the CCWMR component and the principle of meaningful differentiation.
Figure 2: CCWMR ratings with an improvement dimension (5, 10, and 15 percentage point increases) based on districts’ 2022–23 and 2023–24 readiness rates
Recommendation: DEW should set a high bar for annual improvement for districts with low baseline readiness rates. Specifically, in order to receive a bump to three stars, a district or school should have to achieve an annual improvement in its CCWMR rate that falls within the top 20 percent in statewide distribution of improvement rates for the year. This approach would require districts and schools to improve at a substantially higher rate than the average district for a given year. Based on CCWMR data from 2022–23 and 2023–24, this improvement rule would have bumped just twenty-two one- and two-star districts to three stars.
Rigor of the underlying measures
Though not a topic that is specifically covered in the proposed rules, one additional concern with CCWMR should be noted. That is the startling disconnect between several districts’ CCWMR readiness rates and their high school proficiency rates. While proficiency on state exams isn’t a measure included in CCWMR—it’s reflected in the Achievement component—leaving high school with solid math and reading skills is essential to college and career readiness. Achievement and CCWMR need not perfectly correlate, but there are some striking discrepancies in districts’ Algebra I proficiency rates, for instance, and their CCWMR rates. This could lead to questions about what exactly the CCWMR component is measuring as well as the rigor of its indicators.
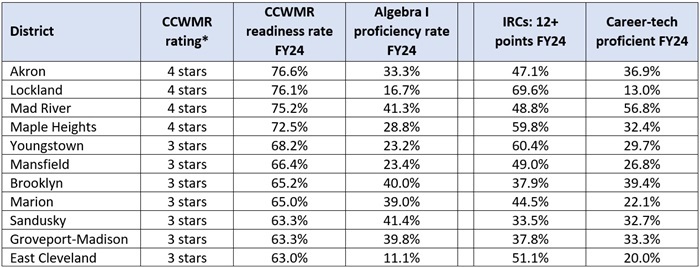
Table 1 illustrates this concern using 2023–24 data from several urban districts. Akron, Lockland, Mad River, and Maple Heights would have received four-star ratings on the CCWMR component based on the proposed grading scale. Yet these same districts posted Algebra I proficiency rates between 17 and 41 percent, well below the state average of 56 percent. Meanwhile, districts such as Youngstown, Mansfield, and East Cleveland would have received three stars on CCWMR, despite abysmal Algebra I proficiency rates of 11 to 23 percent. The columns to the right indicate that these districts had large numbers of students deemed college and career ready by meeting the industry-recognized credential (IRC) benchmark of at least twelve points in a career field or scoring proficient on career-technical exams.
Table 1: Urban districts with high CCWMR rates but low high school algebra proficiency
Recommendations: To ensure the integrity of the underlying CCWMR measures, policymakers should do the following:
Examine the rigor of each of the underlying CCWMR measures. Each post-secondary readiness measure should—on its own—contribute to long-term success of students. To this end, DEW should study the link between these indicators and students’ employment and earnings outcomes, as well as their college-going and -completion rates.
Raise the bar for meeting the IRC indicator. DEW has a couple options to accomplish this.[2] First, they could increase the number of total IRC “points” that students must earn to be deemed ready for CCWMR purposes from twelve (what is used for graduation purposes) to at least eighteen points. Another possibility is to maintain a twelve-point threshold but include a rule that one of the credentials must be worth nine or twelve points. Both options would reduce the possibility of accumulating only low-value credentials to meet the twelve-point mark.
Ensure proficiency on the career-technical exams signifies mastery of technical skills. DEW should make sure that the career-technical exam standards are set at stringent levels. As an initial look at rigor, the state should release the first-time pass rates on these exams—i.e., how many test-takers score proficient or above on an exam.[3] If students are overwhelmingly passing these exams, it would raise questions about the rigor of the assessment and its cut score.
* * *
All students deserve a high school experience that leads to future opportunities in higher education and the workforce. The CCWMR component of the report card promises to ensure this is happening. Full implementation of the component as a rated element and as a factor in schools’ overall ratings would be an important step forward. To live up to its promise, though, policymakers will need to pay attention to the rigor of its measures.
[1] That is, districts get a bump to three stars if their readiness rates from 2022–23 to 2023–24 increased by 5 percentage points (e.g., from 30 to 35 percent).
[2] Statute does not specify the number of points needed to be earned to meet the IRC indicator within CCWMR.
[3] This is not the same as the percentage of students who meet the proficient mark reported in the CCWMR component (which includes all students in a cohort in the denominator, whether or not they took a CTE exam.
Helping parents evaluate their educational options is an important component to effective implementation of school choice policies. Giving them more and better information from which to compare options will likely become essential if choice continues to proliferate. A new paper looks at one common information source—user reviews—to see if it is fit for the task.
Analysts from The National Center for Research on Education Access and Choice (REACH) used a combination of artificial intelligence (natural language processing) and qualitative analysis to study the content and usefulness of user reviews posted on the search tool GreatSchools. Their data include 50 million words of text across more than 600,000 reviews written about 84,000 schools from 2009 to 2019. Their methodology included cleaning and standardizing data (correcting misspellings, removing extraneous words and punctuation marks, making sure every word was recognizable in English, etc.), categorizing comments based on frequently-used words (physical environment, curriculum quality, school staff, etc.), and developing a hierarchy of “usefulness” based on the specificity of the words used. The lattermost component is where AI was particularly helpful.
On the upside, the text reviews on GreatSchools reflect actual user experiences of the schools, making them highly relevant to families considering enrollment. The most common topics discussed in text reviews were overall quality, school staff, and school culture—all very important. User types also covered all the bases—parents (the most common posters), students, teachers, and principals—allowing for an important variety of perspectives. Additionally, since they are provided in response to open-ended requests for comment, text reviews have the potential to provide rich information that can further illuminate common statistical data like test scores and student-teacher ratios.
However, they find that the broad promise of GreatSchools’ text reviews is not generally realized. First, reviews come from a small group of self-selected stakeholders who post on platforms like these. Second is a tendency toward evocative but not particularly informative language, indicative of users highly motivated to either praise or condemn the schools. Reviews focusing on overall quality, perhaps the first thing a prospective parent might read, are a case in point: often vague with hyperbolic words like “wonderful” or “awful,” but providing little useful detail about a school’s specific qualities, strengths, and weaknesses. The analysts also assert that there can be too many reviews for busy parents to read, and that reviews are not organized in any way which could make it easier for readers to quickly determine whether any given review is relevant to them. For example, a long and comprehensive review of a K–8 school could cover important details about staff quality or extracurriculars but turn out to apply only to middle-school-age students, while the reader was interested in elementary-level details.
Interestingly, text reviews of charter schools tended to be longer than those of traditional district schools. Reviews of both charter and private schools included more information about school-level features—including specific differentiators between themselves and traditional schools—and less about school staff. Charter school reviews included more details about instruction and learning, whereas private school reviews included less about physical environment than reviews of traditional district schools.
Finally, the researchers used regression analysis to compare the focus and tenor of text reviews with the star ratings those same users assigned to the schools, broken down by school and user type. In general, reviewers who discussed a school’s overall quality and resources in text reviews ended up giving those schools high ratings, while those who discussed physical environment gave those schools low ratings. Teachers overall gave better star ratings when their text reviews discussed school culture, and parents gave better ratings when their text reviews discussed instruction and learning. High star ratings for traditional district schools (from all user types) were associated more with text reviews focusing on school staff and school-level features, but those same categories were associated with lower star ratings for private schools. All of this taken together reinforces the notion that reviewers base their comments on individual educational values and that two parents (or students or teachers) can experience the exact same school in very different ways.
The report suggests several options for improving the value and functionality of user reviews on GreatSchools and other platforms. They include more closed-ended questions (which the authors note GreatSchools has begun implementing in recent years) and the use of AI tools to collate, prioritize, and summarize large quantities of reviews. These are good ideas, providing AI summaries don’t take precedence over access to the full slate of reviews, and would definitely improve GreatSchools’ usefulness. Research shows that parents investigating schools already get their information from many sources, some of them informal, and that singular details (which may change from year to year and child to child) can be the deciding factor. Increasing the clarity and depth of information sources can only help the cause.
Note: On November 20, 2024, the Ohio House Primary and Secondary Education Committee heard testimony on House Bill 407, which would make substantial changes in the requirements for private schools (termed “chartered nonpublic schools” for the purposes of this bill) to participate in certain state voucher programs. Fordham’s Vice President for Ohio Policy provided opponent testimony to the bill. These are his written remarks.
The Thomas B. Fordham Institute has long advocated for robust public and private school choice programs. At the same time, we’ve also regularly argued that quality—even in choice programs—matters. That’s why the decision to testify in opposition to HB 407 was not taken lightly. While we stand here today as an opponent, we appreciate the chair’s leadership on this issue and for raising some important issues that deserve robust discussion.
We agree with one of the underlying premises of the bill. Namely, parents should have relevant, high-quality information with which to make education decisions. This bill calls for a report card of some sort as a resource for parents. That concept, if not the information the bill proposes to provide, would be a good step. Right now, there isn’t much easily accessed, publicly available information on private schools participating in the state’s voucher programs.
However, because of HB 33, there is about to be a great new resource for parents interested in a private school. Beginning this school year, scholarship students’ growth results will now be calculated and reported. This additional data point (which entails no new testing burdens) will soon provide a clearer picture of the yearly academic progress of students attending private schools. We believe some patience is warranted as this new measure is implemented. We also encourage this body to communicate with the Department of Education and Workforce (DEW) and urge them to make both the current proficiency data and new growth information easier to use and access for Ohio parents. School level academic achievement information should be available to parents interested in attending a private school using a Cleveland or EdChoice Scholarship.
Before turning to my concerns with the sub-bill, I want to briefly comment on the requirement in the as-introduced bill that would have required EdChoice and Cleveland Scholarship recipients to take the state assessment. As many of you remember, up until the 2019 school year, this was the law. Fordham—as a few of you will surely note—expressed concerns about moving from the state assessment to a nationally norm-referenced test. Nonetheless, the change was made.
While we’d still prefer students to take the state assessment, the circumstances have changed since 2019. First, as the table below shows, the number of private schools participating in the voucher programs has increased 25 percent since the testing requirement was removed. (Eligibility was increased, too, though so we can’t establish causality.)
Table 1: Private school participation rates in EdChoice
What percentage of private schools would no longer participate if the testing requirement was changed? How many students are being served in those schools? They are important questions when determining the potential opportunity cost of this shift. Before simply reinstating the testing requirement, these questions should be answered.
While the sub-bill made a significant number of changes, there are a couple of provisions that we strongly believe should not be included.
First, the bill requires a nonpublic school to report its capacity limits by grade level, building, and education program. This language doesn’t increase accountability. There’s no requirement in law for a nonpublic school to fill every seat or prohibition from increasing a class size from 25 to 28 to accommodate a few more students. You know who doesn’t have to report this data, traditional public schools—at least not in a manner that’s publicly available. My guess is that this language was designed to subtly imply that nonpublic schools aren’t taking applicants even though they have the capacity. If so, this seems like an opportune time to remind you that eighty percent of school districts in Ohio participate in open enrollment. The twenty percent that don’t are largely surrounding the state’s urban districts. If we’re going to suggest that nonpublic schools are only taking some students then we should definitely expand our analysis to traditional public schools who—despite their rhetoric—don’t take all students.
Second, the publishing of income data in narrow bands for EdChoice Scholarship recipients is excessive and again will do nothing to increase accountability. It’s a data point that school choice opponents want to use to make public policy arguments. Namely, that EdChoice is being used disproportionately by wealthy people. That’s fine, but we should be honest about it. What’s lost on opponents is that a very wealthy person living in Upper Arlington will have $17,600 taxpayer dollars supporting their child’s high school education. The same parent, sending their child to Bishop Watterson, would receive about $800 in taxpayer support. Yet, the desire remains to profile and call out when wealthy families receive a little bit of public support to offset the cost of a nonpublic education.
So, why do two provisions remain in a private school choice accountability bill when they would do little to improve accountability?
The advocates pushing hardest for the bill in public testimony are the district school boards, superintendents, treasurers associations, and both teachers unions—the entire public-school establishment. These longstanding opponents of private-school choice all plugged some variation of the argument that more regulation is needed to “level the playing field” and to help parents access more information about private schools. Here’s the thing, I’ll go out on a limb and say that whatever accountability changes you made, they will still not support private school choice. Many of the suggestions, in the as-introduced version and sub-bill, would seek to rein in choice and create talking points for future advocacy.
If it was about a level playing field, you might hear advocates argue that once these changes are made private school choice should be funded equitably. I missed that in their testimony. If it was about parent rights, you’d see them drop the lawsuit challenging the legality of the EdChoice Scholarship program.
That hasn’t happened.
If you want to improve accountability in this program, lawmakers should start the conversation with nonpublic school advocates and parent groups. How can we identify bad actors? Where are the weaknesses and potential areas for waste, fraud, or abuse? What do parents want to see when selecting a private school? How can DEW make that information more accessible?
This is an important issue that deserves thoughtful consideration. Fordham is pleased to work with the committee to find a framework that both supports accountability and helps parents find and access great schools.
Thank you again to the chair for starting this conversation.