
The frontier of school district efficiency
Some schools get more for their money
Some schools get more for their money

The baseball playoffs started this week in earnest, with the Cincinnati Reds carrying Buckeye State’s hopes for a pennant (next year for sure, Cleveland fans). This year’s playoffs includes teams with varying levels of economic resources—from the high-spending New York Yankees, to the low-spending, upstart Oakland A’s. Yet, all these teams have proven themselves to be successful over the long regular season.
Schools districts, like baseball teams, are similarly endowed with varying amounts of economic resources. And like baseball teams, some districts get a lot for their money—the Oakland A’s of school districts—while others get little for their money. “Efficiency” generally describes whether an organization gets a lot or a little out of the resources they put in.
To look at which schools are more efficient, we use Ohio public school districts’ expenditure per equivalent (EPE) and performance index score (PI). EPE is the district’s input (the money it expends) and PI is the output (what it gets for the money: namely, student achievement). The Ohio Department of Education (ODE) has developed both of these measures.
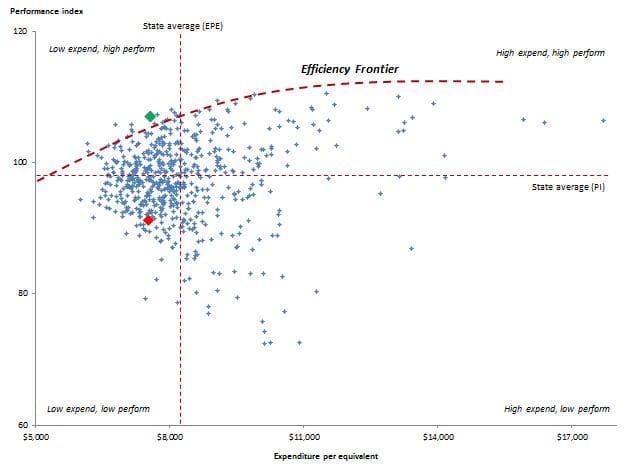
For the sake of simplicity, this analysis is a bird’s-eye view with limitations, some of which are included in the following footnote.[1] Figure 1 below shows each of Ohio’s traditional school districts as a point on the chart, indicating the intersection of EPE and PI for each district in the 2009-10 fiscal year and school year, the last year that EPE data is available on ODE’s website. The chart shows two things that help us understand district efficiency: (1) the efficiency frontier, which is marked in the thick dashed red line and (2) four quadrants that are descriptively labeled by expenditure and academic performance (e.g., low expend, high perform), relative the state averages for PI and EPE. The averages are marked-off by the thin dashed red lines. Normal 0 false false false EN-US X-NONE X-NONE /* Style Definitions */ table.MsoNormalTable {mso-style-name:"Table Normal"; mso-tstyle-rowband-size:0; mso-tstyle-colband-size:0; mso-style-noshow:yes; mso-style-priority:99; mso-style-parent:""; mso-padding-alt:0in 5.4pt 0in 5.4pt; mso-para-margin-top:0in; mso-para-margin-right:0in; mso-para-margin-bottom:10.0pt; mso-para-margin-left:0in; line-height:115%; mso-pagination:widow-orphan; font-size:11.0pt; font-family:"Calibri","sans-serif"; mso-ascii-font-family:Calibri; mso-ascii-theme-font:minor-latin; mso-hansi-font-family:Calibri; mso-hansi-theme-font:minor-latin; mso-bidi-font-family:"Times New Roman"; mso-bidi-theme-font:minor-bidi;}
Figure 1: Estimation of school district efficiency, performance index versus expenditure per equivalent, 2009-10, Ohio traditional public school districts
Source: Ohio Department of Education, Education Fiscal Data Project
First, the efficiency frontier, a term used by economists: The districts along the frontier indicate the most efficient schools, using the metrics chosen here. (The curve is eyeballed, not mathematically derived.) Districts on the interior of the frontier are less efficient than those on the frontier. For instance, consider Fort Laramie Local, which resides on the frontier. It gets more PI out of the same expenditure than, say, Eastern Local. Fort Laramie (point shown in bright green) spends $7,561 and has a PI of 107; meanwhile, Eastern (point shown in bright red) spends $7,516 EPE and has a PI of 91.
Second, I mark-off quadrants that show four types of school districts, based on their EPE and PI relative the statewide means. The top left quadrant (low expend, high perform) shows districts that spend less than average, but receive better than average achievement. These districts are generally efficient (though, even among this group, there are more efficient districts—those that lie on the frontier). Meanwhile, districts in the bottom right quadrant (high expend, low perform) are unquestionably inefficient: they expend a lot and get little achievement.
The analysis here is a simple but useful tool for identifying the efficiency of Ohio’s school districts. Surely, further research needs to be done to identify more precisely which districts are efficient according to multiple measures of input and output. This would require a more sophisticated analysis. Further, the analysis doesn’t attempt to explain why and how some districts achieve greater efficiency than other districts. Better management? Smarter use of technology? More effective teaching? Any of these variables could improve the efficiency of a given school district.
Businesses—and even baseball teams (like this year’s low-spending, playoff-bound Oakland A’s)—have figured out how to become leaner and more efficient, without sacrificing the quality of the output. With the flat-lining of resources available for education, it’s time that schools also learn to be efficient. Efficiency doesn’t mean that that kids have to lose; as we’ve seen, there are districts that spend less and get a lot from their kids.
[1] The analysis, for example, assumes that all districts seek to maximize PI (which may not be the case—some may want to maximize, e.g., the number of students who pass AP tests), that PI is the only measure of academic achievement (it doesn’t incorporate Ohio’s value-added metric), and that each district has the same resource and political constraints. The analysis is also for a single period only. More complex methods of analyses could be applied to address these limitations: see, for example, the World Bank’s website on public spending efficiency.
We are now in the twentieth year of charter schools and during that time a lot has been learned about those that work and those that fail. Roland G. Fryer of The Hamilton Project discusses some of the lessons learned in his new report Learning from the Successes and Failures of Charter Schools.
Fryer analyzed videos, surveys, and lottery data from 35 charter schools in New York City to distinguish practices that generate student achievement. He found that the traditional components districts link to success—class size, per pupil expenditure, percent of teachers with advanced degrees—were not related to high reading and math scores.
So what are successful charters doing differently compared to lower performers? Consistently high-achieving charter schools had five practices in common: 1) increased professional development; 2) data-driven instruction; 3) high-dosage, personalized instruction that targets curricula to the level of each student; 4) increased time on task; and 5) a strong emphasis on high academic expectations.
These methods are working for charters, and may also find success in traditional schools. Preliminary outcomes from pilot programs that implemented these strategies in Denver and Houston public district schools show a sharp increase in student achievement. Fryer acknowledges that all five components may not fit with each district. However, he is fervently optimistic that students in some of the lowest performing schools can improve their academic performance over the next eight years using these strategies—but at a per-pupil cost of about two thousand dollars per year.
With budget cuts across the board, states like Ohio may be wary of an additional expense. Luckily, as Fryer points out, one effective tool costs almost nothing: establishing an environment of high expectations for staff, faculty, and students. Although results from the public school pilot programs are still coming in, there is promise in these findings for charters and traditional schools alike.
SOURCE: Roland G. Fryer, Jr., Learning from the Successes and Failures of Charter Schools (Washington D.C.: The Hamilton Project, September 2012).
The Thomas B. Fordham Foundation’s application process for new charter schools for next school year just wrapped up, and we are pleased to announce that two new schools – a KIPP elementary school and a KIPP middle school – have been approved by the board of the Thomas B. Fordham Foundation for sponsorship.
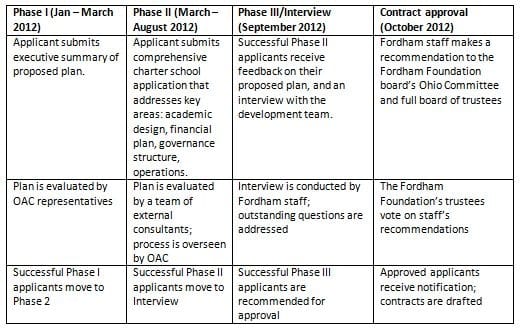
These two schools underwent a comprehensive application process (outlined in figure 1, below), which, in partnership with our colleagues from the Ohio Authorizer Collaborative (OAC), began in January 2012.
Nine applicants began our 2013 application cycle (which opened in January 2012), and school designs varied widely. Of the nine, three promising applications were approved to move forward during the initial review phase. After review by a team of external consultants with relevant experience in school finance, academics and governance, two were moved on to the final phase of the application process and subsequently approved by the Fordham Foundation to open. Approvals were granted based on the strength and alignment of key components of the application, including the proposed education, finance, governance and operations plans, and, the interview.
Figure 1: Thomas B. Fordham Foundation New Charter School Application Process
Both new KIPP start-ups will be governed by KIPP: Central Ohio. This is the board for the current KIPP Journey Academy in Columbus (see figure 2 for its enrollment growth). Like Journey, both schools (yet to be named) will be located in Columbus. (Exact locations will be determined at a later date.) The new middle school will open in August 2013 with grade five, and at full capacity in 2017 it will serve 320 students in grades five through eight (adding one grade per year). The elementary school will open in 2014 with kindergarten, and will ultimately serve 450 students in grades kindergarten through four (also growing one grade per year). School leaders have already been selected and are currently going through the Fisher and Miles fellowships respectively. We are pleased that KIPP: Central Ohio will be able to serve upwards of a 1,000 students in Columbus by 2017.
Figure 2: KIPP Journey Academy enrollment growth, 2008-09 to 2012-13

Source: Ohio Department of Education, Power User Report (2009 to 2011) and Ohio Department of Education, Community Schools Payment Report (2012 to 2013)
Our 2014 application cycle will open in January 2013; access to the 2014 application will be available here. Great charter operators are urged to apply!
The Ohio Alliance for Public Charter Schools (OAPCS) named Ms. Lynnly Wood its 2012 Teacher of the Year. Ms. Wood is a fifth-grade reading teacher at KIPP Journey Academy. OAPCS praised Ms. Wood’s ability to teach students who come to her classroom with varying levels of reading ability. For example, Ms. Wood has implemented a Guided Reading program for her students. This program provides every one of her three-hundred plus students differentiated reading instruction every day. The personalized instruction that Ms. Wood uses has produced impressive results: In 2011, Ms. Wood was the KIPP network’s top-performing fifth-grade reading instructor!
We at Fordham are very pleased and grateful to have outstanding teachers like Ms. Wood and the many other teachers who daily teach the ABCs of life to students who attend Fordham-sponsored charter schools. For more about Ms. Wood’s accomplishments, please continue reading here.
The baseball playoffs started this week in earnest, with the Cincinnati Reds carrying Buckeye State’s hopes for a pennant (next year for sure, Cleveland fans). This year’s playoffs includes teams with varying levels of economic resources—from the high-spending New York Yankees, to the low-spending, upstart Oakland A’s. Yet, all these teams have proven themselves to be successful over the long regular season.
Schools districts, like baseball teams, are similarly endowed with varying amounts of economic resources. And like baseball teams, some districts get a lot for their money—the Oakland A’s of school districts—while others get little for their money. “Efficiency” generally describes whether an organization gets a lot or a little out of the resources they put in.
To look at which schools are more efficient, we use Ohio public school districts’ expenditure per equivalent (EPE) and performance index score (PI). EPE is the district’s input (the money it expends) and PI is the output (what it gets for the money: namely, student achievement). The Ohio Department of Education (ODE) has developed both of these measures.
For the sake of simplicity, this analysis is a bird’s-eye view with limitations, some of which are included in the following footnote.[1] Figure 1 below shows each of Ohio’s traditional school districts as a point on the chart, indicating the intersection of EPE and PI for each district in the 2009-10 fiscal year and school year, the last year that EPE data is available on ODE’s website. The chart shows two things that help us understand district efficiency: (1) the efficiency frontier, which is marked in the thick dashed red line and (2) four quadrants that are descriptively labeled by expenditure and academic performance (e.g., low expend, high perform), relative the state averages for PI and EPE. The averages are marked-off by the thin dashed red lines. Normal 0 false false false EN-US X-NONE X-NONE /* Style Definitions */ table.MsoNormalTable {mso-style-name:"Table Normal"; mso-tstyle-rowband-size:0; mso-tstyle-colband-size:0; mso-style-noshow:yes; mso-style-priority:99; mso-style-parent:""; mso-padding-alt:0in 5.4pt 0in 5.4pt; mso-para-margin-top:0in; mso-para-margin-right:0in; mso-para-margin-bottom:10.0pt; mso-para-margin-left:0in; line-height:115%; mso-pagination:widow-orphan; font-size:11.0pt; font-family:"Calibri","sans-serif"; mso-ascii-font-family:Calibri; mso-ascii-theme-font:minor-latin; mso-hansi-font-family:Calibri; mso-hansi-theme-font:minor-latin; mso-bidi-font-family:"Times New Roman"; mso-bidi-theme-font:minor-bidi;}
Figure 1: Estimation of school district efficiency, performance index versus expenditure per equivalent, 2009-10, Ohio traditional public school districts
Source: Ohio Department of Education, Education Fiscal Data Project
First, the efficiency frontier, a term used by economists: The districts along the frontier indicate the most efficient schools, using the metrics chosen here. (The curve is eyeballed, not mathematically derived.) Districts on the interior of the frontier are less efficient than those on the frontier. For instance, consider Fort Laramie Local, which resides on the frontier. It gets more PI out of the same expenditure than, say, Eastern Local. Fort Laramie (point shown in bright green) spends $7,561 and has a PI of 107; meanwhile, Eastern (point shown in bright red) spends $7,516 EPE and has a PI of 91.
Second, I mark-off quadrants that show four types of school districts, based on their EPE and PI relative the statewide means. The top left quadrant (low expend, high perform) shows districts that spend less than average, but receive better than average achievement. These districts are generally efficient (though, even among this group, there are more efficient districts—those that lie on the frontier). Meanwhile, districts in the bottom right quadrant (high expend, low perform) are unquestionably inefficient: they expend a lot and get little achievement.
The analysis here is a simple but useful tool for identifying the efficiency of Ohio’s school districts. Surely, further research needs to be done to identify more precisely which districts are efficient according to multiple measures of input and output. This would require a more sophisticated analysis. Further, the analysis doesn’t attempt to explain why and how some districts achieve greater efficiency than other districts. Better management? Smarter use of technology? More effective teaching? Any of these variables could improve the efficiency of a given school district.
Businesses—and even baseball teams (like this year’s low-spending, playoff-bound Oakland A’s)—have figured out how to become leaner and more efficient, without sacrificing the quality of the output. With the flat-lining of resources available for education, it’s time that schools also learn to be efficient. Efficiency doesn’t mean that that kids have to lose; as we’ve seen, there are districts that spend less and get a lot from their kids.
[1] The analysis, for example, assumes that all districts seek to maximize PI (which may not be the case—some may want to maximize, e.g., the number of students who pass AP tests), that PI is the only measure of academic achievement (it doesn’t incorporate Ohio’s value-added metric), and that each district has the same resource and political constraints. The analysis is also for a single period only. More complex methods of analyses could be applied to address these limitations: see, for example, the World Bank’s website on public spending efficiency.
We are now in the twentieth year of charter schools and during that time a lot has been learned about those that work and those that fail. Roland G. Fryer of The Hamilton Project discusses some of the lessons learned in his new report Learning from the Successes and Failures of Charter Schools.
Fryer analyzed videos, surveys, and lottery data from 35 charter schools in New York City to distinguish practices that generate student achievement. He found that the traditional components districts link to success—class size, per pupil expenditure, percent of teachers with advanced degrees—were not related to high reading and math scores.
So what are successful charters doing differently compared to lower performers? Consistently high-achieving charter schools had five practices in common: 1) increased professional development; 2) data-driven instruction; 3) high-dosage, personalized instruction that targets curricula to the level of each student; 4) increased time on task; and 5) a strong emphasis on high academic expectations.
These methods are working for charters, and may also find success in traditional schools. Preliminary outcomes from pilot programs that implemented these strategies in Denver and Houston public district schools show a sharp increase in student achievement. Fryer acknowledges that all five components may not fit with each district. However, he is fervently optimistic that students in some of the lowest performing schools can improve their academic performance over the next eight years using these strategies—but at a per-pupil cost of about two thousand dollars per year.
With budget cuts across the board, states like Ohio may be wary of an additional expense. Luckily, as Fryer points out, one effective tool costs almost nothing: establishing an environment of high expectations for staff, faculty, and students. Although results from the public school pilot programs are still coming in, there is promise in these findings for charters and traditional schools alike.
SOURCE: Roland G. Fryer, Jr., Learning from the Successes and Failures of Charter Schools (Washington D.C.: The Hamilton Project, September 2012).