At the conclusion of a harangue about our school choice recommendations, Stephen Dyer accuses Fordham of ignoring “the 90 percent of [district] students who don’t participate in these options.” The finger-pointing is nonsense given our longstanding advocacy for policies that benefit students no matter where they attend school. Truth is, we want all Ohio students to achieve at higher levels, including pupils who attend district schools and those who choose non-district options.
But is he right that 90 percent of Ohio students attend district schools? It’s worth a closer look because the statistic is commonly cited by school choice critics to suggest near-unanimous support for traditional public schools, with only a few non-conformists opting out.
When we actually dig into the data, we find that 90 percent is an exaggeration. In truth, about 80 percent of Ohio students attend district schools, and even that number requires some additional nuance.
Table 1 displays Ohio’s enrollments for 2020–21, the most recent year of available data.[1] Traditional school districts, including students attending joint-vocational districts, served just over 1.5 million students (82 percent), with private schools enrolling about 162,000 students (9 percent) and public charter schools enrolling 114,000 students (6 percent). Roughly 52,000 students were homeschooled (3 percent) and a small share attended an independent STEM school or a state-supported organization. Note that within the traditional district system, roughly 83,000 students exercised choice through interdistrict open enrollment. Thus, the percentage of students attending a traditional public school in their home district is closer to 75 percent.
Table 1: Ohio’s K–12 enrollment by educational option in 2020–21
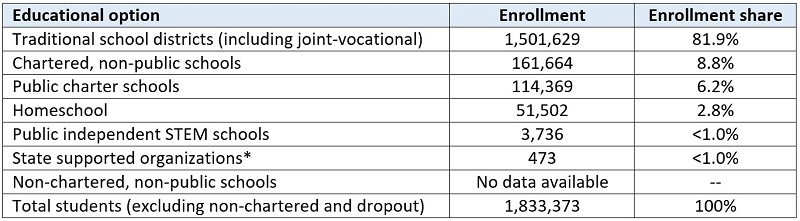
This isn’t even a complete accounting of each and every school-aged child in Ohio. As indicated in the table above, the state doesn’t report the number of students attending non-chartered, non-public schools, i.e., private schools that for religious reasons choose not to be formally chartered by the state (and are ineligible to participate in state scholarship programs). Nor is there a count of adolescents of compulsory education age who did not attend school in 2020–21. If they were included, the district share would decline.
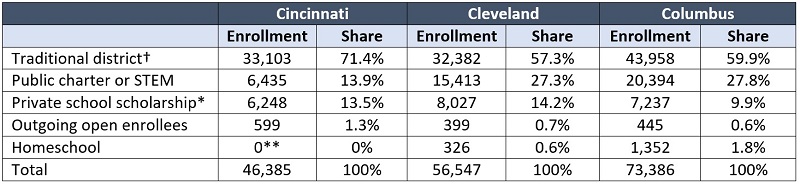
The statewide averages, of course, include areas of Ohio with few to no private or public charter schools. When we look at enrollment patterns in urban areas with more expansive school options available, we see much larger proportions of students enrolled in non-district alternatives—and consequently, lower district shares of enrollment. As the table below indicates, the Cincinnati school district educates just shy of three quarters of the city’s students, while in Cleveland and Columbus about three in five students are educated in district schools. These numbers are overestimates, as we don’t have data on tuition-paying private school students residing in these cities. Interdistrict open enrollment also occurs in the three districts. In Cincinnati, for example, 862 non-resident students enrolled in the district, while 599 resident students attended a surrounding district through open enrollment.[2]
Table 2: K–12 enrollment in Columbus, Cleveland, and Cincinnati, 2020–21
Overall, the picture of traditional public school enrollments is more nuanced than the “90 percent” rhetoric. For starters, it’s inaccurate—not even a rounding error—and critics should at least update their talking point. And it’s nowhere close to being true for Ohio’s big-city districts. We must also remember that in many places across Ohio, parents have few non-district options apart from homeschooling or online schools. Recall, too, that school funding policies advantage districts, as parents pay taxes to their local district; many, therefore, must “double pay” (taxes plus tuition) to access private schools.
To be sure, traditional public school students still represent a sizeable majority of students in Ohio. But that doesn’t indicate near-universal approval of districts. Nor does it mean that we ignore the wishes of parents who prefer alternative educational options.