
What to make of Ohio school report cards’ “progress” rating
The Ohio Department of Education and Workforce (DEW) will soon release Ohio’s school report cards for the 2023–24 school year.

The Ohio Department of Education and Workforce (DEW) will soon release Ohio’s school report cards for the 2023–24 school year.


The Ohio Department of Education and Workforce (DEW) will soon release Ohio’s school report cards for the 2023–24 school year. These report cards, which will be available on the DEW website, assign an overall quality rating (from one to five stars) to each school and district based on up to five individually-rated components: Achievement, Progress, Gap Closing, Graduation, and Early Literacy. The least understood of these components is Progress, which is based on statistical estimates of how much “value added” schools provide in terms of student test scores. This metric is meant to isolate schools’ contributions to student learning from the multitude of other factors that affect students’ performance on standardized tests, such as family and environmental influences.[1]
This post explains what the Progress indicator captures and how schools and communities might interpret Progress ratings.[2] Because of how these ratings are presented on school and district report cards, some will overreact to their schools’ ratings, while others won’t give the ratings the attention they deserve. The information below is intended to temper both of these reactions by helping stakeholders understand the value and limitations of Progress ratings.
What does the Progress rating capture?
The Progress indicator, according to school and district report cards, “looks closely at the growth all students are making based on their past performances.” Each school or district receives a rating from one to five stars, and next to this rating the report card provides a short description of what the rating means. These descriptions appear in Table 1, focusing on schools as opposed to districts for the purpose of illustration.
Table 1. Official descriptions of Progress ratings provided on school report cards

The report cards rightly feature concise definitions of each rating, but the five-star rating system (which the General Assembly codified in law) and the report-card descriptions (provided in Table 1) take some significant liberties in characterizing the underlying value-added estimates. In particular, they imply sharp distinctions in school quality when, in fact, there may be minimal statistical support for those distinctions. They are also vague in how they characterize achievement growth, which has led to significant misunderstandings. Table 2 restates the official rating descriptions in an attempt to clarify them and to better capture what the underlying value-added estimates convey about school quality.
Table 2. Alternative descriptions of Progress ratings on school report cards
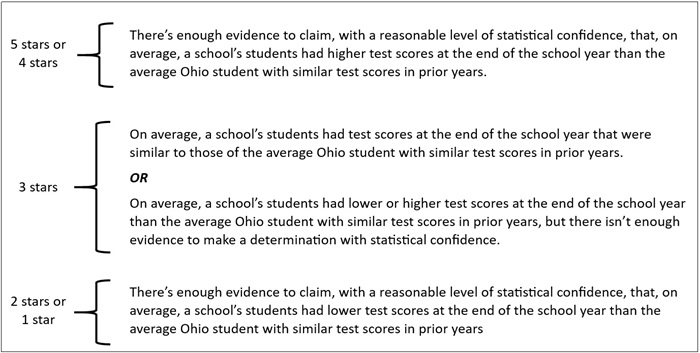
One difference between the official school Progress rating descriptions (Table 1) and the modified rating descriptions (Table 2) is that the latter clarify that, in the context of value-added models, “growth expectations” are based on comparing test scores between students in a single year. Specifically, students who “met growth expectations” are those whose test scores at the end of the school year were about the same as those of other students with similar test scores in prior years.[3] In other words, growth expectations have nothing to do with whether students are reading or doing math at grade level, for example, or making one year’s worth of academic progress based on Ohio’s academic content standards. Indeed, if the average student has fallen behind in terms of grade-level content (as happened during the pandemic), then a school might obtain a three-star rating—and a signal that their students have “met growth expectations”—because they are just as far behind as other students. In other words, the Progress rating is a relative measure, not an absolute one.
A second difference is that the modified descriptions in Table 2 categorize schools receiving five stars similarly to those receiving four stars, and they categorize schools receiving two stars similarly to those receiving one star. That is because the method by which value-added estimates are translated to specific ratings does not in fact enable one to distinguish with statistical confidence between five-star and four-star schools or between two-star and one-star schools. Although the underlying estimated value-added effect sizes do indeed differ between five-star and four-star schools (and between two-star and one-star schools), those differences could just be statistical noise. We simply don’t know which is the case for a particular school or district due to how value-added estimates are translated to ratings.
A third difference is that the modified rating descriptions in Table 2 provide two possible interpretations of the three-star rating. Whereas Ohio report cards label a three-star rating as providing “evidence that the school met student growth expectations,” the description in Table 2 basically states that we don’t know with statistical confidence whether a school’s average student test score was above, at, or below the average for students with similar test scores in prior years.
The extent to which these last two points are an issue for a given school or district depends on the number of tested students used in the value-added calculation. That’s because, under the current system, schools and districts could receive different ratings due to differences in the statistical confidence associated with value-added estimates, as opposed to differences in actual performance. In general, the more test scores used to generate a value-added estimate, the more confident we are that a particular star rating is the correct one for that school or district.
More specifically, the informativeness of the ratings depends in part on the number of tested students in a school or district in a given year, as well as the number of years of annual value-added estimates that are averaged together to generate the Progress rating. Smaller schools and districts, and schools with a small number of tested grades, may get ratings of three stars simply because there are not enough data to determine what rating they should receive. Similarly, ratings that are based on just a single year of value-added estimates are likely to misclassify a lot of schools and districts. Indeed, research suggests that school ratings should be based on a multi-year average of school value-added estimates.[4]
Thus, setting aside issues related to the pandemic that might lead to highly unstable Progress ratings from year to year,[5] the informativeness of the Progress rating and associated report-card descriptions can depend significantly on the school or district at hand, as well as whether the rating is based on a multi-year average of annual value-added estimates.
Some rules of thumb for interpreting the Progress component in the 2024 report cards
One should put more weight on Progress ratings for larger schools with more tested grades than for smaller schools with fewer tested grades. Similarly, one should put more weight on ratings for districts than those for individual schools. Perhaps most importantly, one should put more weight on the forthcoming 2024 Progress ratings (based on a three-year average of value-added estimates) than on Progress ratings from 2022 (based on the 2021–22 school year only) or 2023 (based on 2021–22 and 2022–23 value-added estimates). For example, if the school in question has few students and only two tested grades (e.g., a typical K–4 elementary school), then one should not read much into a school Progress rating of three stars, and one should not read too much into any rating (from one to five stars) if that rating is from 2022 or 2023. If, on the other hand, one is concerned about the effectiveness of a particular school district and the Progress rating is based on a three-year average (as will be the case in the forthcoming 2024 report card), then a three-star rating becomes meaningful.
One should not make strong distinctions between four and five stars or between one and two stars, even if a school or district has many tested grades and the Progress rating is based on three years of value-added estimates (as will be the case in the forthcoming 2024 report card). Going forward—beginning with the forthcoming 2024 report card—one should take notice if a school or district moves between one/two stars and three stars, between three stars and four/five stars, and, especially, from one/two stars to four/five stars. Movement would then likely capture improvements or declines in student learning (relative to the average Ohio student). That said, for districts or large schools with many tested students, distinctions between four/five and one/two stars become meaningful if they are observed for multiple years (e.g., if a district receives five-star ratings for multiple years beginning with the 2024 report card).
Remember that if value-added estimates are based on a sufficient amount of data, schools and districts that “met growth expectations” are those whose student test scores were about the same as those of other Ohio students with similar prior test scores. Thus, if students are behind to begin with, they may stay behind even if they continue to meet “growth expectations.” The easiest way to determine whether a school’s students are behind is to consult the report card’s Achievement rating, which provides insight into how students perform against the state’s grade-level academic standards.
That said, do not ignore the Progress rating!
Value-added statistical techniques, such as those used to generate the Progress rating, are currently the most valid way to isolate schools’ contributions to student learning, holding constant the numerous other factors that affect student achievement—including poverty, family support, and innate ability. Value-added estimates also capture student learning equally for all students, regardless of the knowledge and skills they had prior to attending a school. In contrast to absolute measures of student achievement, value-added measures level the playing field and incentivize schools to help all students learn.[6] Thus, Ohio’s value-added Progress indicator is the best measure available to assess school quality, provided that we are aware of its limitations and consider it along with other measures of student educational outcomes.
[1] A discussion of the extent to which value-added estimates successfully isolate schools’ contributions to student learning, and how much weight to assign to test-based metrics overall, is beyond the scope of this post. For now, it is fair to say that the “value added” approach to measuring academic progress is likely the best means available to isolate the true impact of Ohio schools—at least when it comes to student achievement in the tested grades and subjects. It is also fair to say that such achievement measures are predictive of students’ future income and other measures of wellbeing (e.g., lower rates of criminality and teenage pregnancy).
[2] I hope to describe in a future post how schools can access and interpret the underlying “effect sizes,” which are available on the DEW website and can provide more concrete information on how effectively schools are educating their students.
[3] As in the Ohio report cards, the descriptions in Table 2 are also stylized and take some liberties—particularly when stating that comparisons are made to other students with similar past scores. It would be more accurate to say that value-added models indicate whether a student’s test scores are higher or low than those of the average Ohio student after controlling for students’ prior test scores, grade level, and test taken. Put differently, value-added techniques employ statistical procedures meant to compare test scores across all Ohio students as if all students had similar past test scores, were in the same grade, and took the same tests. Thus, in reality, the “expected growth” benchmark for comparison is the average Ohio student, as opposed to the average Ohio student with similar past test scores. The shorthand in Table 2 is meant to convey that the statistical modeling attempts to compare students as if they were academically similar prior to the school year.
[4] The linked study suggests a three-year average for performance indicators that weight value-added heavily. Ohio’s 2024 ratings will be the first post-pandemic Progress ratings to be based on a three-year average of school value-added estimates. They will put more weight on the 2023–24 value-added estimates than on prior years’ estimates, however, so they may still be less stable than a three-year average that weights each year’s value-added equally.
[5] For example, schools where students fell furthest behind during the pandemic might have made more progress in 2021–22 or 2022–23 simply because they had more ground to make up—not because they are better at educating their children. More generally, schools with very high (or low) scores one year are likely to have lower (or higher) scores the following year. In statistical terms, this general phenomenon is known as “regression to the mean.”
[6] Ohio’s Achievement indicator considers multiple performance thresholds and, thus, better captures student achievement across the student ability distribution than a simple proficiency rate, for example. However, an influx of higher-achieving students could make a school seem like it is improving when, in reality, its students may not be learning more than before. The Progress rating takes account of students’ past test performance and, thus, largely mitigates this problem.

Columbus City Schools, the largest district in Ohio, has long been riddled with chaos and dysfunction. Its failure to transport hundreds or thousands of city schoolchildren is just the latest chapter.
Just over a decade ago, the district was rocked by a data scrubbing scandal perpetrated by bureaucrats who tampered with student records to inflate district ratings. The ringleader, “data czar” Steve Tankovich, was jailed for his role in the scrubbing. Though avoiding prison, former superintendent Gene Harris hightailed it out shortly after the scandal broke and was found guilty of dereliction of duty.
The problems haven’t ended there. In 2019, the leader of the district-owned radio station falsified invoices and got probation. The district was painfully slow to reopen after the pandemic subsided and vaccines were available to educators, thus further aggravating student learning loss. Then Columbus went through a three-day teachers union strike that threw the start the 2022–23 school year into turmoil. This year, the school board has dithered on closing underenrolled buildings, something that would free up room in the budget to boost student supports.
On the academic side, the district continues to leave too many students woefully ill-prepared for life after high school. In 2022–23, just 35 percent of Columbus third graders read proficiently on their state test and 17 percent of high school students achieved proficiency on the algebra I exam. A staggering 58 percent of students were chronically absent (missing more than 10 percent of the school year). As for longer-term outcomes, a paltry 13 percent of its class of 2016 earned an associate degree or above by their mid-twenties. These results lag way behind the state average. For instance, only nineteen districts (out of roughly 600) posted lower third grade reading proficiency rates than Columbus and just eight were lower in algebra I.
It’s hard to imagine a district sinking any lower. But the ongoing fiasco in which Columbus City Schools is refusing to provide transportation proves the district is more than capable.
Under longstanding statute, Ohio districts are responsible, with narrow exceptions, for providing transportation to non-district students residing in their boundaries. This law helps ensure that all students receive busing no matter which school they choose to attend—district, charter, or private. The policy also promotes fairness to taxpaying families opting for other alternatives, while supporting student safety, reducing congestion on the roads, and ensuring that buses operate at full capacity.
The Columbus school board and superintendent have chosen to defy state law in a brazen attempt to deny transportation to students who attend public charter or private schools. As justification, they point to a provision that allows districts to deem students “impractical” to transport in certain circumstances. It’s true that other districts have wriggled out of transporting charter and private school students through this loophole, but none have abused this provision quite like Columbus. In fact, over the past couple years, the state has levied millions in fines against Columbus for failing to provide transportation to non-district students.
These fines have not deterred the district from continuing to refuse resident students transportation. At their August and September meetings, the school board declared a large number of Columbus charter and private school students “impractical.”[1] In doing so, they yanked transportation from families and students right as the new school year was beginning in clear violation of statute, which requires a declaration to be made at least thirty days prior to a school’s first day of instruction. It’s also a stunning display of callous disregard for Columbus families—most of whom are low-income and don’t have other transportation alternatives—and for fellow educators, who can’t teach students if they can’t make it to school.
In comments to the school board, a student attending Metro STEM school in Columbus voiced her safety concerns about having to use public transit instead of receiving yellow bus transportation. “I have lost my ability to feel safe making my way to school.” When learning her grandchildren were deemed “impractical,” one Columbus grandmother told the media, “I had to have a talk with my grandkids to let them know that they may not be able to go to their [charter] school anymore. That hit them hard. Everybody was crying. Grandmas are always supposed to have the answer, and this time I don't.”
Fortunately, this reprehensible disrespect for state law and the needs of parents and students is not going unnoticed by state officials. Earlier this week, Ohio Attorney General Dave Yost sent the Columbus superintendent a sternly written cease-and-desist letter. He wrote, “It appears that the District has chosen to ignore its legal obligations to transport thousands of students, perhaps calculating that the District is better off paying future non-compliance fines than meeting its current legal obligations.” Attorney General Yost promised in the letter to bring the issue to the courts, and he has since announced that his office will indeed file suit.
With any luck, the attorney general’s actions will put an immediate end to district intransigence. If not, further disciplinary and accountability measures should be taken. Those might include initiating proceedings to revoke the license of the Columbus superintendent. Statute empowers the State Board of Education to revoke educator licenses for “conduct unbecoming” to the profession, which under state professional conduct code includes “committing any violation of state or federal laws, statutes or rules.” In addition, community, philanthropic, and business leaders should hold Columbus City Schools to account by promising to oppose future levy requests or withholding grant support until the district cleans up its act on transportation.
The citizens of Columbus deserve better than this. Leaders of public school systems should be upholding the law, not undermining it. They should be supporting parents and students, not bringing on hardship and anxiety. School officials, more than anyone, should be modelling for pupils and the community what good citizenship looks like—and that includes following the law, even when it’s difficult.

’Tis the season: Schools across Ohio are opening their doors to welcome back students for a brand-new academic year. As in years past, teachers and administrators will be responsible for educating an increasingly diverse group of students, including more students with disabilities than ever before. Not only will schools need to provide the services outlined in these students’ Individualized Education Programs (IEPs), they will also need to address the lingering impacts of the pandemic.
To ensure that schools are meeting the needs of Ohio’s hundreds of thousands of students with disabilities, state and local leaders, lawmakers, and families need access to accurate and detailed information. With that in mind, let’s take a closer look at some of the data that are currently available.
Enrollment
Chart 1 shows the number of students with disabilities who have enrolled in Ohio public schools[1] since 2016. During 2023, the most recent year of available data, more than a quarter million public school students were identified as students with disabilities. They made up more than 16 percent of all public school students in Ohio.
Chart 1: Enrollment numbers for students with disabilities in Ohio’s public schools
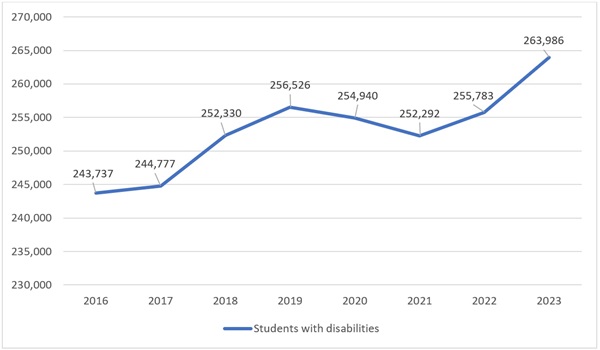
The significant jump in enrollment between 2021 and 2023 could be explained by several factors. Some families held off on enrolling their students in kindergarten because of Covid, either choosing to homeschool or to delay enrollment for a year (children aren’t legally required to begin school until they’re six, which gave parents of five-year-olds the option to wait). Meanwhile, remote learning may have made it more difficult for schools to identify students who were in need of special education services. It makes sense that once schools returned to in-person classes, the number of special education students would increase—thereby continuing the upward trend established prior to the pandemic.
Private schools have also seen a significant bump in the number of students with disabilities, perhaps in part because of remote learning. During the height of the pandemic, districts reported that complying with the Individuals with Disabilities Education Act (IDEA) and providing support to students with disabilities was substantially more difficult than before. Families tried to “have grace” for schools but were often left frustrated by the turmoil and struggling to cope with considerable challenges, including a lack of in-person services and support for their children. For many, private schools—which were more likely to offer in-person instruction than public district or charter schools—became a lifeline.
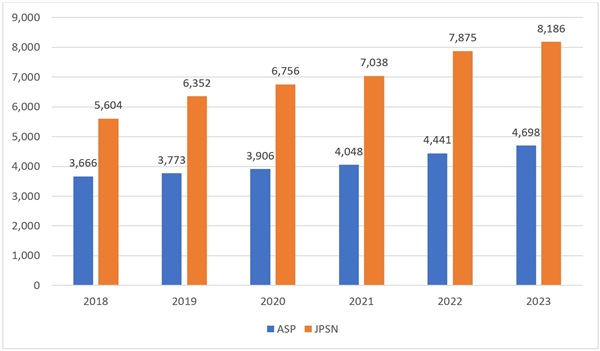
In Ohio, there are data indicating that an increasing number of families did, in fact, choose to enroll in private schools. Chart 2 shows the number of students participating in Ohio’s Autism Scholarship Program (ASP) and the Jon Peterson Special Needs (JPSN) Scholarship Program. Both allow families to use state-funded scholarships[2] to send children with special needs to education programs other than the one operated by their resident district. JPSN saw the biggest increase in enrollment, with more than 2,500 additional participants in 2023 than 2018. ASP participation also increased, though by fewer students, likely because a broader range of students are eligible for JPSN than for ASP.
Chart 2: Participation in Ohio’s voucher programs for students with special needs
Academic outcomes
Like the rest of the nation, academic achievement in Ohio suffered during the pandemic. For the most part, test scores are rebounding. But that rebound is much less robust for students with disabilities. Consider charts 3 and 4, which show the percentage of students with disabilities who were proficient on state exams in English language arts and math compared to the same results for all students. These data, and those that follow, are for public school students (including those in charter schools).
Chart 3: Percent proficient on state exams in ELA, grades 3–8
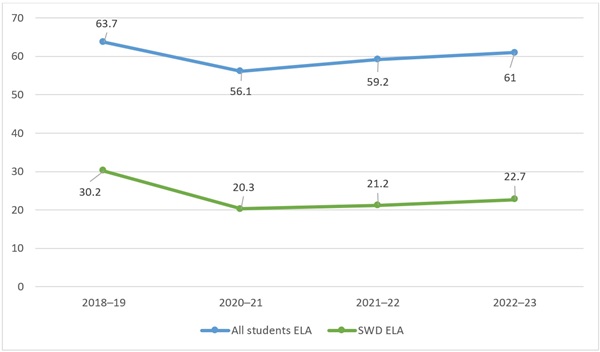
Chart 4: Percent proficient on state exams in math, grades 3–8
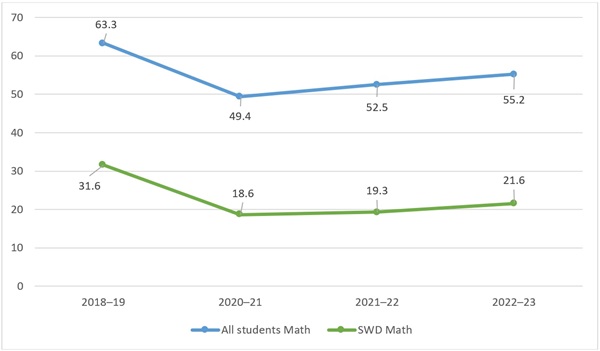
Statewide, achievement in ELA has almost returned to pre-pandemic levels. There’s still plenty of work to do in math to catch students up, but scores are steadily increasing from pandemic-era lows. For students with disabilities, however, the picture isn’t as rosy. In both subjects, achievement remains nearly 10 percentage points lower than it was prior to the pandemic.
Meanwhile, although students with disabilities are struggling to recover the academic ground they lost during the pandemic, graduation rates have not declined. In fact, they’ve increased. The table below identifies the four-year longitudinal graduation rate for students with disabilities, students without disabilities, and all students. Across all groups, and despite persistent learning loss, graduation rates have ticked upward.
Table 1: Four-year longitudinal graduation rates for Ohio students

Going forward
This year and for the foreseeable future, Ohio schools need to prioritize ensuring that their students with disabilities are catching up from pandemic learning loss. But there are two roadblocks that could stand in their way.
The first is chronic absenteeism, which is defined as missing at least 10 percent of instructional time. Not only does chronic absenteeism negatively impact both academic and social-emotional development, it’s also made pandemic recovery more difficult. Chart 4 shows the statewide chronic absenteeism rate compared to the rate for students with disabilities. Rates for both groups dipped during the first pandemic-impacted school year and then skyrocketed during the following two. The numbers slightly improved last year—which is good news—but they still haven’t returned to pre-Covid levels. And among students with disabilities, chronic absenteeism rates are even higher than the statewide average. More than a third of students with disabilities were chronically absent during the 2022–23 school year.
Chart 5: Chronic absenteeism rates in Ohio
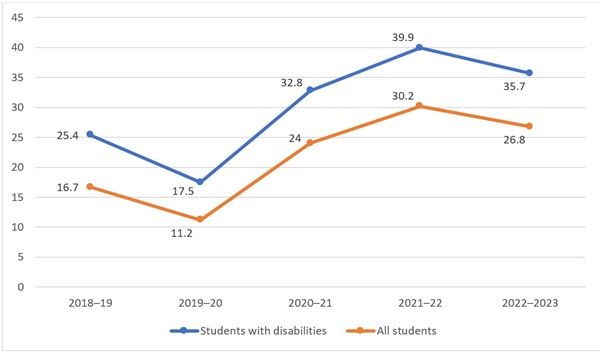
It’s important to recognize that for students with disabilities, attending school regularly can be far more difficult than it is for their peers. Chronic health conditions, side effects from medication, social issues like bullying, and attending necessary doctor or therapy appointments can all play a role in contributing to chronic absenteeism. A global pandemic likely exacerbated many of these issues for Ohio families. Going forward, it’s crucial for school staff to work closely with families to improve attendance while also recognizing extenuating circumstances.
The second roadblock is teacher shortages. Staff vacancies data collected by the National Center for Education Statistics (NCES) in March 2024 show that 51 percent of public schools nationwide reported that they would need to fill positions in special education before the start of the next school year. That’s up from 46 percent in June 2022. No other category of teaching is more in demand.
It’s difficult to get a handle on special education teacher shortages in Ohio. The NCES data are disaggregated by region, rather than at the state level, and Ohio doesn’t collect or publish data on teacher vacancies. (That needs to change, and soon.) But based on the data that are available for Ohio, special education is a likely shortage area, especially as the number of special education students rises.
***
The pandemic has impacted all students. But for Ohio’s growing number of students with disabilities, those impacts are lingering longer. Issues including chronic absenteeism and teacher shortages could make academic recovery more difficult. The upcoming release of state report cards will shed additional light on how students are progressing. But for now, schools should be laser-focused on meeting the needs of their students with disabilities.
[1] Public school enrollment includes traditional district, public charter, and independent STEM school students. It does not include students attending joint-vocational districts, educational service centers, non-public schools, or home-schooled students.
[2] The maximum scholarship amount for ASP for FY25 is $32,445. For JPSN, the amount of each scholarship is based on students’ Evaluation Team Report. For FY25, the maximum scholarship amounts ranges from $9,585 for speech or language impairment to $32,445 for autism, a traumatic brain injury, or students who are hearing and vision impaired.

Since 2022, public schools in the District of Columbia have been working to mitigate Covid learning disruptions by establishing and ramping up high-impact tutoring (HIT) efforts. Data on the outcome of these efforts are beginning to emerge, and a new report from the National Student Support Accelerator (NSSA) shows some minimally encouraging signs.
NSSA is an offshoot of the Stanford Accelerator for Learning and Systems Change for Advancing Learning and Equity, an initiative focused on researching how tutoring can best benefit students. Its new report looks at the first full year of HIT implementation in D.C. schools during 2022–23. Tutoring efforts that year concentrated on math and English language arts (ELA) for students in all grades and was focused on schools—both district and charter—with the greatest concentrations of students identified as at risk. It’s interesting to note that “at risk” doesn’t generally mean academic risk for schools in the district, but rather centers primarily on student socioeconomic status and homelessness, in the context of this wholly-academic intervention. Pre-existing academic need appears not to have been a driving force in choosing where tutors were placed, although some data suggest that academic performance may have influenced teachers’ decisions on which students to refer for tutoring.
A total of 5,135 students in 151 schools received HIT. Eligible buildings were those in which 40 percent or more of their students were categorized as at risk. Approximately 52 percent receiving HIT were district (DCPS) students, with charter school students making up the remainder. Overall, 6 percent of all D.C. public school students—and just 8 percent of all students categorized as at risk—received HIT. Of these students, 3,240 received tutoring in ELA and 2,558 in math. Tutoring hours received were highest in grades K–2, falling off starting in grade three. High school freshmen and seniors received the fewest hours of tutoring. Students, on average, participated in twenty-seven individual sessions. Seventy percent of students participated in eleven or more tutoring sessions. The report includes some details on the widely varying types of tutoring offered.
For students in grades K–8, achievement in math was measured by iReady assessments taken at the beginning, middle, and end of the year. These findings reflect DCPS students only; no data for charter school students were able to be calculated. Tutoring students began the school year 0.19 standard deviations below their non-tutored peers and ended the school year 0.14 standard deviations below. While tutored students still scored below their non-tutored classmates, the gap between the two groups did diminish, and students who received more tutoring shrunk the gap the most. Students who participated in more than twenty tutoring sessions were able to shrink their gap with non-tutored peers from 0.23 standard deviations to 0.14 standard deviations. The same pattern was observed in an analysis of Reading Inventory Scores for tutored and non-tutored students. This analysis covered a fuller cohort, including grades 2–12, but again did not include charter students. Outcomes for students in grades 7–12 were measured by the MAP math assessment, and students who received the most tutoring (twenty or more sessions) managed to outscore their non-tutored peers by the final test of the year. A tiny bright spot.
In terms of achievement, data from the annual PARCC assessment, administered in the spring of 2023, were available for all D.C. students, including charter students, for grades 3–11. However, the researchers conclude only that the findings—tutored students fared worse across the board than non-tutored peers and that those who received the most tutoring actually performed the worst of all groups—suggest that teachers likely chose their lowest-performing students to receive tutoring even though that was not a stated criterion for selection.
Non-academic outcomes discussed in the report include school attendance (students with better school attendance participated in more tutoring sessions, on average, and vice versa), student perceptions of tutoring, and tutoring program managers’ impressions of the program.
While these findings are generally positive, they are also rather modest, given the scope of the problem at hand. If the rates of gap closing don’t increase from the snail’s pace observed here, it will take years of additional work for tutored students to meet the test score performance of their non-tutored peers. Older students don’t have years to wait, and two cohorts of students have already graduated since the start of this HIT effort. We also know from this report that tutoring participation declines sharply in higher grades. Additionally, funding for tutoring in D.C. and elsewhere initially came from federal pandemic-relief funds, which are now exhausted and not sure to continue. All signs point to a diminishing effect going forward from the endpoint of these data, which should temper even the most enthusiastic responses to these findings.
SOURCE: Cynthia Pollard et al., “Implementation of the OSSE High Impact Tutoring Initiative: First Year Report School Year 2022–2023,” National Student Support Accelerator (August 2024).

When Ed Kurt came home to Margaretta Local School District in the summer of 2020, it was his second tour as superintendent. He had left the district six years earlier to lead Findlay City Schools.
But things were dramatically different. COVID-19 was raging. The district was providing hybrid instruction to reduce exposure to the virus. Classrooms were split, with groups of students alternating between in-person and online attendance. Teachers and children donned masks. Desks were wiped down between classes. Students were seated in pods separated by barriers.
Children across the country were rapidly falling behind because virtual classrooms were no substitute for in-person learning. Kurt particularly worried about students losing—or not learning—reading skills. When the federal government began distributing emergency pandemic funding to districts, he put most—more than 70 percent—of the $1.7 million Margaretta received over three school years into literacy curriculum and training.
“We think it was a four-year fix (to catch up from COVID),” Kurt said. “But we’re not cancer-free of literacy issues.”
(In 2022–23, the latest available data, 38 percent of Ohio third graders fell short of proficiency on the state reading test, as compared to 33 percent of Margaretta students.)
Situated in Castalia, a village along Lake Erie in northwestern Ohio, Margaretta has about 1,150 students, nearly a third of whom are identified as economically disadvantaged. With eighty teachers and support staff, its schools are the hub of a cluster of small communities in Erie and Sandusky counties, not far from Cedar Point amusement park.
Upon taking over, Kurt and his Curriculum Director Kevin Johnson insisted on adopting curricula based on the Science of Reading, which emphasizes teaching phonics and decoding skills. It was simply a best practice in their view, and one made more urgent by COVID learning losses.
Today, that focus is paying off. In 2023–24, 55 percent of kindergarten students began the year at or above grade level for the expected literacy skills of incoming kindergartners. At the end of the year, an impressive 80 percent were on grade level for skills children should have mastered by the end of the year. The first-grade class went from 36 percent to 56 percent testing at or above grade level. Scores in second grade fell slightly, from 63 percent reading on grade level at the beginning of the year to 61 percent in May, a dip that administrators attribute to the loss of two of four teachers mid-year.
Going all-in on the Science of Reading
When the district began to introduce Science of Reading practices, many Margaretta teachers, like their colleagues across Ohio, were unfamiliar with the teaching methods.
Calling Ohio a “Whole Language” state, Johnson said colleges and universities have trained generations of education majors to teach reading using that method. “Three-Cueing” and “Balanced Literacy” are similar approaches that are not evidence-based and that don’t give children sufficient instruction in phonics and phonemic awareness. Instead, these practices encourage students to look at pictures, guess words from context and memorize sight words, leaving them unable to decode new and increasingly difficult words.
In the first year of Kurt’s superintendency and amid the chaos of COVID, he and Johnson began conversations with teachers about the need to go all-in on instituting Science of Reading curricula. (It was not until July 2023, three years later, that Governor Mike DeWine signed legislation requiring that Ohio public schools teach students using the evidence-based approach and dedicating $168 million to the effort.)
The following summer, before the start of the 2021–22 school year, fifty-six staff members from the elementary, middle and high schools were paid to take thirty hours of Orton-Gillingham training. In addition, a dedicated literacy team of respected staff members was created. Orton-Gillingham Academy representatives also were brought in, while the University of Findlay, nearby educational service centers and an Ohio Department of Education and Workforce Support Team provided professional development in the Science of Reading.
Then, in 2022–23, the district received a $200,000 grant from the state to advance its literacy work. More training followed. The elementary school also began implementing “flooding,” a practice in which intervention specialists, aides, and student teachers descend on classrooms to work with students individually or in small groups to address reading deficits.
This past school year, the district rounded out its Science of Reading-based curricula, adopting Wit and Wisdom in grades K–5. That program is designed to improve vocabulary and comprehension, two of the five pillars of the Science of Reading that the district concluded it wasn’t sufficiently addressing. (The other pillars are phonemic awareness, phonics, and fluency, which the Orton-Gillingham method focuses on.)
While a “culture of literacy” took hold fairly quickly at the elementary level, buy-in was not as strong initially in the upper grades, said Heather Campana, a literacy coach. “I think that’s natural. They (middle school and high school teachers) are content-driven. They think, ‘I’m a mathematician.’ ‘I’m a scientist.’ … (But) as the students grow in their knowledge of science and math, for example, the words get longer and longer. So we need to know and understand, as teachers, how to support students in decoding multisyllabic words.”
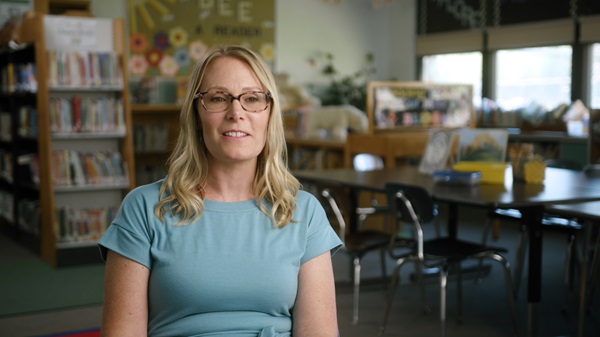
Alyssa Fitz, a middle school intervention specialist, said helping older students improve their decoding skills increases their reading fluency. “If they’re spending so much time decoding words, they’re not going to get the comprehension,” she said.
Tranette Novak, a speech and language pathologist, said, “We have to get it right (at the elementary level). … If you don’t close that gap, it gets bigger. What we can do in a half hour (of intervention) takes two hours at the older grades. Where are you going to find those hours (in a middle or high school day)?”
Three years into instituting Science of Reading curricula and practices system-wide, Kurt said, “Change is really hard,” acknowledging that not everyone has been supportive of the move. “We have had some people leave,” he said.
New rigor isn’t too much for students
Kristy Jensen, a third-grade teacher and eighteen-year teaching veteran, said she is sold on Wit and Wisdom, the new, highly scripted K–5 curriculum that focuses on building vocabulary and increasing comprehension. It requires teachers to spend ninety minutes each day delving into topics like ocean life and the solar system, with children learning vocabulary that is typically two years above grade level.
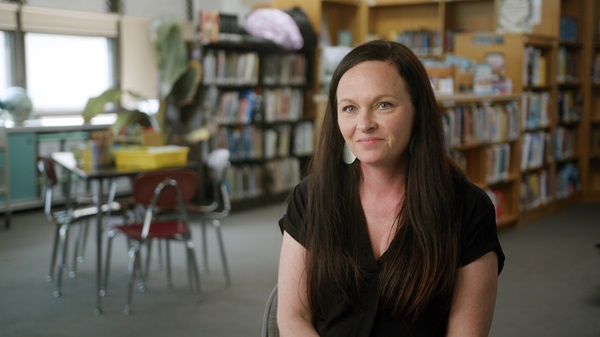
“The best thing I’m seeing is their interest level,” Jensen said. Though she initially was concerned about the complexity of the text, she said, “They’re looking up facts on the weekend and coming in and telling me about what they found. They were enthralled about giant squids.”
At parent-teacher conferences this past school year, Jensen for the first time encountered families who said their child’s favorite subject is reading.
Shannon Bramel, a kindergarten teacher, agrees that Wit and Wisdom is rigorous and fosters high-level thinking. She said the books in the new curricula are rich in knowledge about topics many students haven’t been exposed to, recalling, for example, a story about the Galápagos Islands. After hearing her read aloud to them, students are encouraged to ask themselves, What do you wonder? What did you notice? “They have to think about what they’re listening to and come up with their own thoughts,” Bramel said.
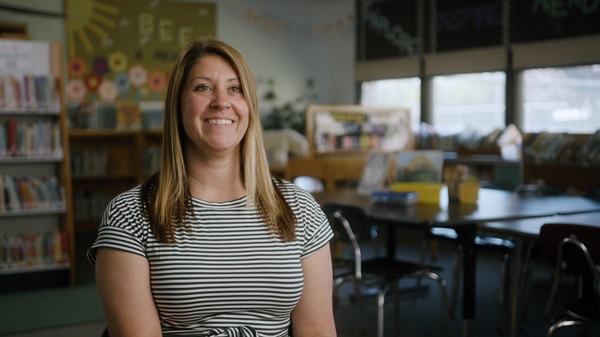
Megan Olds, a first-grade teacher, echoed Jensen’s enthusiasm for Wit and Wisdom and Geodes, a supplemental curriculum to Wit and Wisdom. Referring to Geodes, she said, “To have these decodable books that are working on a skill, it’s life-changing. The kids love them. They also are teaching critical thinking skills. I have students saying, ‘The essential question is. …’”
Beyond Wit and Wisdom’s ninety minutes of reading instruction, K–3 teachers spend forty minutes on phonics each afternoon, followed by forty minutes of intervention, during which students are grouped according to their skill level.
Margaretta’s reading curricula and instructional materials
Margaretta Local Schools uses the following science-of-reading-based curricula:
The district uses Acadience Learning for screening and progress monitoring in K–3 and i-Ready in grades 2–5. The Orton-Gillingham methodology is embedded alongside the district’s curricula, and an Orton-Gillingham Fellow has been training the district’s literacy leaders.
One day in May, Bramel was teaching her kindergarten students about how to determine whether a word ends in “ck” or “k” and about “sneaky e’s” on the end of words. “The ‘e’ helps make the word’s long vowel sound,” Bramel explained, moving quickly through examples like “bake” and “shine” while students recited examples with her.
One challenge Bramel and her fellow teachers have encountered is that state-approved Science of Reading curricula does not always align with the state standards they’re supposed to teach, resulting in students not being introduced to specific skills or knowledge at the grade level Ohio prescribes. “I almost think standards are going to have to change at some point,” she said.
With the introduction of Science of Reading, Margaretta is also doing robust progress monitoring. For two years, it has used Acadience assessments to do at least bi-weekly checks in reading and math. The progress check-ins identify the specific skills that are stumping students. “Before we had Acadience, we didn’t know how well they were doing,” said Teal Balduff, a Title 1 reading specialist.
Superintendent Kurt and Johnson, Margaretta’s curriculum director, said that purchasing quality Science of Reading-based curricula and training teachers is a huge financial burden for school districts. The federal Elementary and Secondary School Emergency Relief (ESSER) Fund that Margaretta tapped, for example, is about to end.
“I don’t have a general fund overflowing with money,” Kurt said. “You lose teachers (every year), and you have other teachers come in. We have to train our newbies.”
To ensure the district can provide ongoing training and coaching, Margaretta has adopted a train-the-trainer model, investing heavily in professional development for a limited number of staff who then instruct colleagues.
“The burden is going to be on public schools to provide the training to their teachers until all the universities agree that this (the Science of Reading) is how we teach reading,” Johnson said. (Ohio has mandated teacher education programs begin teaching their university students based on the Science of Reading starting in January 2025.)
And he believes that Ohio’s new law requiring that current teachers receive eighteen hours of training in the Science of Reading “forces the issue” but falls short of the professional development required to practice Science of Reading principles well, particularly for those who have been using nonevidence-based methods throughout their careers. “Districts are finding this out. You’re just scratching the surface (with that amount of training).”
Kurt said that using the Science of Reading in the early grades gives students essential foundational reading skills, but it also supports districts’ bottom lines. They can’t afford to do the ongoing intervention that is needed when students aren’t taught from the beginning to read according to research-based instructional practices.
“Our committees have looked at the reading stats,” Kurt said, and they suggest the district can get to the point where 90 percent of students are reading on grade level. “If that doesn’t get you excited as a teacher, you might want to go do something else.”
Acknowledgments
We at the Fordham Institute are deeply grateful to the many people who contributed to this work. Foremost, we extend thanks to Ellen Belcher and videographers Ransome Rowland and Colton Puterbaugh of B2 Studios, whom we commissioned to shine light on Ohio schools that are putting the Science of Reading into practice. We appreciate their professionalism in working with educators, as well as their ability to capture what this approach to literacy instruction looks like in classrooms. We extend special thanks to Ed Kurt, superintendent of Margaretta Local Schools, for agreeing to participate in the project. We also wish to thank the educators who took time out of their busy schedules to share their thoughts and experiences. On the Fordham team, we wish to thank Jeff Murray, who assisted with report production and dissemination. Kathi Kizirnis copyedited the manuscript and Stephanie Henry created the design. Funding for this report comes from the Charles and Lynn Schusterman Family Philanthropies and our sister organization, the Thomas B. Fordham Foundation.
Aaron Churchill, Ohio Research Director