Foreword
By Aaron Churchill
Does expanding educational options harm traditional school districts? This question—a central one in the school choice debate—has been studied numerous times in various locales. Time and again, researchers have returned with a “no.” Choice programs do no harm to school districts, and in many instances even lead to improvements through what economists call “competitive effects.” Brian Gill of Mathematica Policy Research, for instance, reports that ten out of eleven rigorous studies on public charter schools’ effects on district performance find neutral to positive outcomes. Dozens of studies on private schools’ impacts on districts (including ones from Ohio) find similar results.
This research brief by the Fordham Institute’s Senior Research Fellow, Stéphane Lavertu, adds to the evidence showing that expanding choice options doesn’t hurt school districts. Here, Dr. Lavertu studies the rapid expansion of Ohio’s public charter schools in some (largely urban) districts during the early 2000s. He discovers that the escalating competition in these locales nudged districts’ graduation and attendance rates slightly upward, while having no discernable impacts on their state exam results.
Considered in conjunction with research showing that Ohio’s brick-and-mortar charters outperform nearby districts, we can now safely conclude that charters strengthen the state’s overall educational system. Charters directly benefit tens of thousands of students, provide additional school options to parents, and serve as laboratories for innovation—all at no expense to students who remain in the traditional public school system.
It’s time that we finally put to rest the tired canard that school choice hurts traditional public schools. Instead, let us get on with the work of expanding quality educational options, so that every Ohio family has the opportunity to select a school that meets their children’s individual needs.
Introduction
Compelling evidence continues to show that the emergence of charter schools has had a positive impact on public schooling. Recently, professors Feng Chen and Douglas Harris published a study in a prestigious economics journal that found that students attending public schools—both traditional and charter public schools—experienced improvements in their test scores and graduation rates as charter school attendance increased in their districts.[1] Based on further analysis, the authors conclude that the primary driver was academic improvement among students who attended charter schools (what we call “participatory effects”) though there were some benefits for students who remained in traditional public schools (due to charter schools’ “competitive effects”).
These nationwide results are consistent with what we know from state- and city-specific studies: Charter schools, on average, lead to improved academic outcomes among students who attend them and minimally benefit (but generally do not harm) students who remain in traditional public schools. The estimated participatory effects are also consistent with what we know about Ohio’s brick-and-mortar charter schools, which, on average, have increased the test scores and attendance rates of students who attend them.
Feng and Harris’s study provides some state-specific estimates of charter schools’ total impact (combined participatory and competitive effects) in supplementary materials available online, but those appendices report statistically insignificant estimates of the total effects of Ohio charter schools. How could there be no significant total effect, given what we know about the benefits of attending charter schools in Ohio? One possibility is that their data and methods have limitations that might preclude detecting effects in specific states. Another possibility, however, is that their null findings for Ohio are accurate and that charter schools’ impacts on district students are sufficiently negative that they offset the academic benefits for charter students.[2]
To set the record straight, we need to determine Ohio charter schools’ competitive effects—that is, their impact on students who remain in district schools. The novel analysis below—which addresses several limitations of Feng and Harris’s analysis[3]—indicates that although the initial emergence of charter schools had no clear competitive effects in terms of districtwide student achievement, there appear to have been positive impacts on Ohio districts’ graduation and attendance rates. Combined with what we know about Ohio charter schools’ positive participatory effects, the results of this analysis imply that the total impact of Ohio’s charter schools on Ohio public school students (those in both district and charter schools) has been positive.
There are limitations to this analysis. For methodological reasons, it focuses on the initial, rapid expansion of charter schools between 1998 and 2007. And although it employs a relatively rigorous design, how conclusively the estimated effects may be characterized as “causal” is debatable. But the research design is solid and, considered alongside strong evidence of the positive contemporary impacts of attending Ohio’s brick-and-mortar charter schools, it suggests that Ohio’s charter sector has had an overall positive impact on public schooling. Thus, the evidence indicates Ohio’s charter-school experience indeed tracks closely with the positive national picture painted by Chen and Harris’s reputable study.
Estimating the impact of charter school market share on Ohio school districts
A first step in estimating competitive effects is obtaining a good measure of charter school market share that captures significant differences between districts in terms of charter school growth.[4] Figure 1 illustrates the initially steep increase in the share of public school students in the average “Ohio 8” urban district[5] (from no charter school enrollment during the 1997–98 school year to nearly 14 percent enrollment during the 2006–07 school year) as well as the much more modest increase in the average Ohio district (nearly 2 percent of enrollment by 2006–07).[6] The rapid initial increase in some districts (like the Ohio 8) but not others provides a pronounced “treatment” of charter school competition that may be sufficiently strong to detect academic effects using district-level data.
Figure 1. Charter market share in Ohio districts
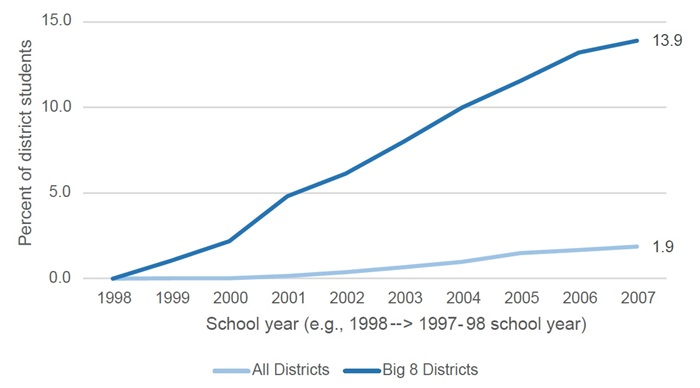 Note. The figure plots average charter market share in over 600 Ohio districts and in Ohio’s eight large urban districts, from the 1997–98 school year through the 2006–07 school year. Market share data were calculated using district payment reports and come from Jason Cook’s (2018) study.
Focusing on the initial introduction of charter schools between 1998 and 2007 provides significant advantages. To detect competitive effects, one must observe a sufficient number of years of district outcomes so that those effects have time to set in. It can take time for districts to respond to market pressure, and there may be delays in observing changes in longer-term outcomes, such as graduation rates. On the other hand, it is important to isolate the impact of charter schools from those of other interventions (notably, No Child Left Behind, which led to sanctions that affected districts after the 2003–04 school year) and other events that affected schooling (notably, the EdChoice scholarship program and the Great Recession after 2007). Because these other factors may have disproportionately affected districts that were more likely to experience charter school growth, it is easy to misattribute their impact to charter competition. To address these concerns, the analysis focuses primarily on estimating the impact of the initial growth in charter enrollments on district outcomes three and four years later (e.g., the impact of increasing market share between 1998–2003 on outcomes from 2001–2007).
After creating a measure that captures significant differences between districts in initial charter school growth, the next step is to find academic outcome data over this timespan. Ohio’s primary measure of student achievement for the last two decades has been the performance index, which aggregates student achievement levels across various tests, subjects, and grades. It is a noisy measure, but it goes back to the 2000–01 school year and, thus, enables me to leverage the substantial 1998–2007 increase in charter school market share. In addition to performance index scores, I use graduation and attendance rates that appeared on Ohio report cards from 2002 to 2008 (which reflect graduation rates from 2000–01 to 2006–07 and include attendance rates from 2000–01 to 2006-07).[7]
Using these measures, I estimate statistical models that predict the graduation, attendance, and achievement of district students in a given year (from 2000–01 to 2006–07) based on historical changes in the charter school market share in that same district (from 1997–98 to 2006–07), and I compare these changes between districts that experienced different levels of charter school growth. Roughly, the analysis compares districts that were on similar academic trajectories from 2001 to 2007 but that experienced different levels of charter entry in prior years. A major benefit of this approach is that it essentially controls for baseline differences in achievement, attendance, and graduation rates between districts, as well as statewide trends in these outcomes over time. And, again, because impact estimates are linked to charter enrollments three and four years (or more) prior to the year in which we observe the academic outcomes, the results are driven by charter-school growth between 1998 and 2003—prior to the implementation of No Child Left Behind and EdChoice, and prior to the onset of the Great Recession.
Finally, I conducted statistical tests to assess whether the models are in fact comparing districts that were on similar trajectories but that experienced different levels of charter entry. First, I conducted “placebo tests” by estimating the relationship between future charter market shares and current achievement, attendance, and graduation levels in a district. Basically, if future market shares predict current academic outcomes, then the statistical models are not comparing districts that were on similar academic trajectories and thus cannot provide valid estimates of charter market share’s causal impact. I also tested the robustness of the findings to alternative graduation rate measures and the inclusion of various controls that capture potential confounders, such as changes in the demographic composition of students who remained in districts. The results remain qualitatively similar, providing additional support for the causal interpretation of the estimated competitive effects.[8]
Findings
Finding No. 1: A 1-percentage-point increase in charter school market share led to an increase in district graduation rates of 0.8 percentage points four years later. That implies that districts with a 10 percent charter market share had graduation rates 8 percentage points higher than they would have had in the absence of charter school competition.
I begin with the analysis of graduation rates. Figure 2 (below) plots the estimated impact of increasing charter market share by one percentage point on district-level graduation rates. Roughly, the thick blue line captures differences in achievement between districts that experienced a one percentage point increase in charter market share to those that did not experience an increase. Year 0 is the year of the market share increase, and the blue line to the right of 0 captures the estimated impact of an increased market share one, two, three, four, and five (or more) years later. The dotted lines are 95 percent confidence intervals, indicating that this interval would contain the estimate 95 percent of the time if the statistical test were repeated.
The results indicate that an increased charter market share had no impact on district graduation rates in the first couple of years. However, an increase in charter market share of 1 percentage point led to district graduation rates that, four years later, were 0.8 of a percentage point higher than they would have been in the absence of charter competition. Thus, if the average district had a charter market share of 10 percent in 2003, the results imply that they would have realized graduation rates that are 8 percentage points higher in 2007 (i.e., 0.8 x 10 four years later). For a typical Ohio 8 district that experienced a 14 percent increase in charter market share, that was the equivalent of going from a graduation rate of 57 percent to a graduation rate of 68 percent.
Figure 2. Impact of charter market share on districts’ graduation rates (2001–2007)
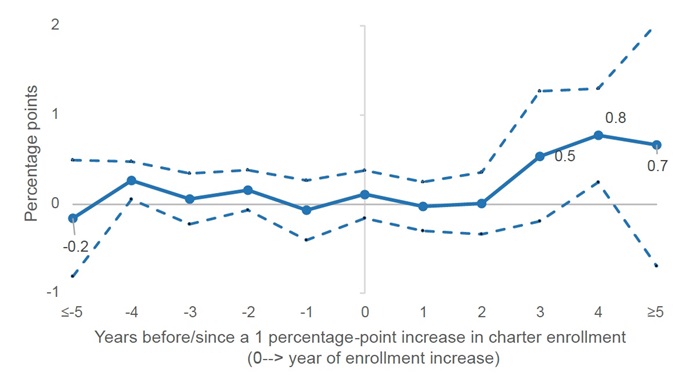 Note. The figure plots the estimated impact of increasing charter school market share on districtwide graduation rates, from five years (or more) prior to a 1-percentage-point increase in the market share to five years (or more) after the increase. The estimates are from two-way fixed-effects models that include district and school-year fixed effects and that were estimated using 2001–2007 graduation rate data and 1998–2012 market-share data (to capture the impact of market share increases before 2001 and to conduct placebo tests based on market share increases after 2007). The dotted lines demarcate 95 percent confidence intervals.
Importantly, as the estimates to the left of the y axis reveal, there are no statistically significant differences in graduation rates between districts that would go on to experience a 1-percentage-point increase in market share (in year 0) and those that would not go on to experience that increase. This is true one, two, three, four, and five (or more) years prior. Controlling for changes in districts’ student composition (e.g., free-lunch eligibility, race/ethnicity, disability status, and achievement levels) does not affect the results. Finally, although the estimates in Figure 1 are statistically imprecise (the confidence intervals are large), the Year 4 estimate is very close in magnitude to the statistically significant estimate (p<0.001) based on a more parsimonious specification that pools across years (see appendix Table B1). These results suggest that competition indeed had a positive impact on district students’ probability of graduation.
One potential limitation of this study is that the market share measure includes students enrolled in charter schools that are dedicated to dropout prevention and recovery. If students who were likely to drop out left district schools to attend these charter schools, then there would be a mechanical relationship between charter market share and district graduation rates. This dynamic should have a minimal impact on these graduation results, however. First, in order to explain the estimated effects that show up three and four years after charter market shares increase, districts would have needed to send students to dropout-recovery schools while they were in eighth or ninth grade (they couldn’t be in grades ten to twelve, as the dropout effects show up in Year 4); and these students needed to be ones who would go on to drop out in eleventh or twelfth grade (as opposed to grade nine or ten). That is a narrow set of potential students. Second, for this dynamic to explain the results (where a one-percentage-point increase in charter market share leads to an 0.8-percentage-point decrease in dropouts), then a large majority of the market share increase that districts experienced would need to be due to these students who would eventually drop out. Given the small proportion of charter students in dropout-recovery schools and the even smaller proportion of those who meet the required profile I just described, it seems that shipping students to charters focused on dropout prevention and recovery can be only a small part of the explanation.
Finding No. 2: A 1-percentage-point increase in charter school market share led to an increase in district attendance rates of 0.08 percentage points three years later. That implies that districts with a 10 percent charter market share had attendance rates 0.8 of a percentage point higher than they would have had in the absence of charter school competition.
The results for district attendance rates are also imprecise, with unstable point estimates and large confidence intervals in Years 4 and 5 (or later). But Figure 3 indicates a statistically significant effect in Year 3 of 0.08 percentage points, and this Year-3 estimate is very close in magnitude to the statistically significant estimate (p<0.01) based on a more parsimonious specification that pools across years (see appendix Table B1). For the typical Ohio 8 district, the estimated effect is the equivalent of their attendance rate going from 90.5 percent to 91.6 percent.
Figure 3. Impact of charter market share on districts’ attendance rates (2001–2007)
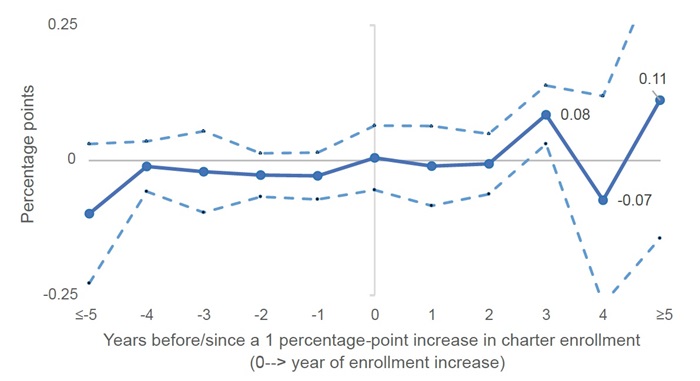 Note. The figure plots the estimated impact of increasing charter school market share on districtwide attendance rates, from five years (or more) prior to a 1-percentage-point increase in the market share to five years (or more) after the increase. The estimates are from two-way fixed-effects models that include district and school-year fixed effects and that were estimated using 2001–2007 attendance rate data and 1998–2012 market share data (to capture the impact of market share increases before 2001 and to conduct placebo tests based on market share increases after 2007). The dotted lines demarcate 95 percent confidence intervals.
Thus, as was the case with graduation rates, these by-year estimates are imprecise, but they confirm more precise estimates from models that pool across years, provide evidence that there is a plausible time lag between increases in market share and increases in attendance rates, and provide some confidence that the results are not attributable to pre-existing differences between districts that experienced greater (as opposed to lesser) increases in charter competition. That the timing of attendance effects roughly corresponds to increases in graduation rates provides further support that the results don’t merely capture statistical noise.
Finding No. 3: An increase in charter school market share did not lead to a statistically significant change in districts’ scores on the performance index.
The results for districtwide student achievement indicate no statistically significant effects (see Figure 4, below). Unfortunately, we lack the statistical power to rule out effects that one might deem worthy of attention. Additionally, the immediate (statistically insignificant) decline in the performance index in the year of the market share increase (Year 0) might be attributable to relatively high-achieving students leaving for charter schools and thus might not capture changes in student learning. If high-achieving students were more likely to go to charter schools, then districts’ performance index scores should decline in exactly the year that charter market shares increased.[9]
Figure 4. Impact of charter market share on districts’ scores on the performance index (2001–2007)
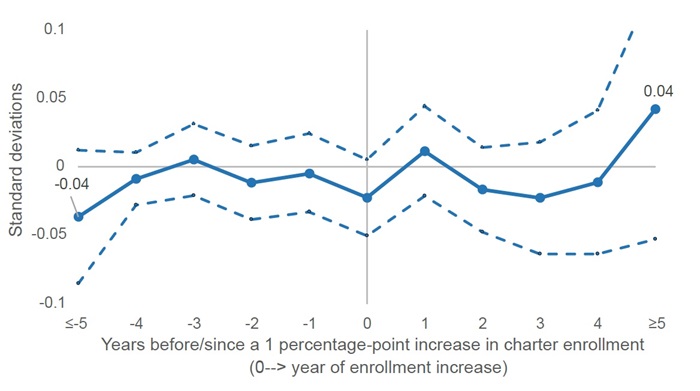 Note. The figure plots the estimated impact of increasing charter school market share on districtwide performance index scores, from five years (or more) prior to a 1 percentage-point increase in the market share to five years (or more) after the increase. The estimates are from two-way fixed-effects models that include district and school-year fixed effects and that were estimated using 2001–2007 performance index data and 1998–2012 market-share data (to capture the impact of market share increases before 2001 and to conduct placebo tests based on market share increases after 2007). The dotted lines demarcate 95 percent confidence intervals.
The results of a simple model that pools across years indicates a negative relationship between charter market share and district performance index scores (see Table B1 in the appendix). The results in Figure 4, however, put into question this negative correlation between charter market share and district performance index scores. Controlling for future market share (as does the model used to generate Figure 4) renders statistically insignificant the estimates from Year 1 to Year 4. That the coefficient for five years (or more) prior is -0.04 and nearly statistically significant suggests that the relationship in Table B1 between market share and the performance index may be attributable to the fact that districts experiencing declines in achievement were more likely to subsequently experience charter school growth, as opposed to the other way around.[10] The estimate from the simple performance-index model that pools across years is also the only one that is not robust to limiting the analysis to pre-NCLB years (see Table B1 in the appendix).
Despite the somewhat imprecise (and perhaps invalid) statistical estimates of the impact of charter market share on districts’ performance index scores, what one can say is that the analysis rules out large declines in the achievement levels of district students. Additionally, these results are similar to those of a 2009 RAND study that found no statistically significant differences in student-level test score growth among students who attended a traditional public school that had a charter school in close proximity, as compared to students whose traditional public schools were farther from the nearest charter school. That study did not leverage the initial growth in the charter school sector, but it provides a different type of evidence and relatively precise estimates.
Thus, in spite of the potential limitations related to changes in student composition and imprecise (and perhaps invalid) statistical estimates, the results of this analysis provide one more piece of evidence that charter school competition did not have negative effects on student learning in district schools.
What can we learn from what happened from 1998 to 2007?
The introduction of charter schools in Ohio significantly disrupted school district operations. For example, in 2002, EdWeek documented Dayton Public Schools’s newfound dedication to academic improvement in response to its rapidly expanding charter sector. As Chester E. Finn, Jr. discussed in a post that same year, the district considered a number of reforms—notably the closure of under-enrolled and under-performing schools, which Feng and Harris’s recent study identified as the most likely mechanism explaining the positive impact of charter school competition on districtwide academic outcomes. The results above suggest that, for the average Ohio district experiencing charter school growth, these efforts did not yield large positive impacts on student achievement (though they very well may have in Dayton[11]), nor any discernable negative impacts.
On the other hand, the average Ohio district’s response to charter school competition led to increases in attendance and graduation rates. The more charter competition a district felt, the less likely their students were to miss school or drop out three or four years later. That charter school competition appears to have spurred improvements in Ohio school districts between 2001 and 2007 is particularly remarkable given how maligned Ohio’s charter sector was in those days. Charter schools were not nearly as effective in those early years as they are today (though the best evidence for that time period indicates that brick-and-mortar charter schools were no worse, on average, than district schools). Why that may have occurred is a topic for another day, but one wonders whether keeping students in school (and, thus, keeping the state funds that follow them) became more important to districts as they began to face competition. For now, though, the analysis above provides some further reassurance that it is worthwhile to draw attention to districts with solid charter market shares as an indicator of healthy school marketplaces.
About the author and acknowledgments
Stéphane Lavertu is a Senior Research Fellow at the Thomas B. Fordham Institute and Professor in the John Glenn College of Public Affairs at The Ohio State University. Any opinions or recommendations are his and do not necessarily represent policy positions or views of the Thomas B. Fordham Institute, the John Glenn College of Public Affairs, or The Ohio State University. He wishes to thank Vlad Kogan for his thoughtful critique and suggestions, as well as Chad Aldis, Aaron Churchill, and Mike Petrilli for their careful reading and helpful feedback on all aspects of the brief. The ultimate product is entirely his responsibility, and any limitations may very well be due to his failure to address feedback.
Endnotes
[1] An open-access version of the paper is available here, and an accessible summary of an earlier version of the paper is available here. These results are consistent with those of a prior Fordham study.
[2] Note that their analysis leaves out students in virtual charter schools and those serving special-education students, which suggests that the participant effects should be positive.
[3] The primary limitation of Chen and Harris’s analysis relates to their data. Their study measures important quantities with significant error (e.g., charter market share and graduation rates), does not exploit pronounced differences in charter school growth between districts (e.g., their achievement data begins in 2009, well after the initial and steep charter school growth I examine in my analysis), and focuses on years after the implementation of No Child Left Behind and the onset of the Great Recession (both of which disproportionately affected districts with growing charter sectors). These limitations likely make it difficult to detect effects in specific states, particularly states like Ohio, where the measurement error and lack of market-share variation is significant. I am not criticizing the quality of their valuable nationwide analysis. The data they use are the only option for conducting a rigorous nationwide analysis, as they need measures that are available across states. But when estimating Ohio-specific estimates of charter school effects, these limitations might preclude detecting effects because the signal-to-noise ratio is too low. I provide further details in the appendix.
[4] I thank Jason Cook for kindly sharing these data with me, which he collected for this study of charter competition’s impact on district revenues and expenditures. Note that Cook’s study estimates charter enrollment effects in the post-NCLB period, which may introduce some complications that my study seeks to avoid.
[5] The Ohio 8 districts are Akron, Canton, Cincinnati, Cleveland, Columbus, Dayton, Toledo, and Youngstown.
[6] Average market share increases more slowly and unevenly after 2007, as charter closures became more prevalent in districts with more mature charter sectors. Thus, although average enrollments continued to increase statewide through 2014, there is not a clean upward trajectory in charter market share in every district.
[7] These graduation rates are not as good as the cohort-based graduation rates introduced in later years, but they cover the same time span as the performance index and are based on calculations that account for actual enrollments and dropouts in every high school grade.
[8] Specifically, I estimated two-way fixed-effects panel models with lags and leads of district market share as predictor variables and 2001–2007 achievement, attendance, and graduation rate data as the dependent variables. Scholars have recently identified potential problems with these models, and there are concerns about the extent to which they capture “difference in differences” comparisons that warrant a causal interpretation, which is why I sometimes use qualifiers such as “roughly” when describing what the estimates of my analysis capture. The basic model includes district and year fixed effects, but the results are qualitatively similar when I control for time-varying demographics (e.g., student free-lunch eligibility, race/ethnicity, and disability status). These robustness checks, in conjunction with the use of leads that allow for placebo tests and control for potential differences in district trends, provide reassurance that the estimates are credible. The appendix contains a more precise description of the statistical modeling and results.
[9] Note that there is no estimated change in Year 0 for the attendance and graduation analyses, and if students more likely to attend school and graduate were the ones who switched to charters, that should have led to lower district attendance and graduation rates.
[10] Indeed, this potential explanation is consistent with the design of the charter school law, which in later years permitted the establishment of charter schools in districts that failed to reach performance designations (which were based in large part on the performance index).
[11] Unfortunately, Dayton is one of the handful of districts for which I am missing initial years of data, which means its 2002 efforts—in response to enrollment losses in the preceding two years—do not factor into the estimates above. Additionally, the statistical analysis cannot speak to the effects in a specific district.


