
Senate proposal makes a sensible modification to the “20 mill tax floor”
With property values soaring throughout Ohio—and property taxes climbing upward—state lawmakers have been giving more time and attention to local tax policy.
With property values soaring throughout Ohio—and property taxes climbing upward—state lawmakers have been giving more time and attention to local tax policy. Last year, a joint committee held extensive hearings on property taxes and produced a report with findings and recommendations. Legislators have also introduced various solutions to insulate homeowners from tax hikes, while attempting to make Ohio’s complicated property tax system more intelligible. GOP gubernatorial candidates Vivek Ramaswamy and Dave Yost have also recently spoken about a need for reform.
There are many reforms worthy of consideration. One promising idea, proposed by Senate lawmakers via Senate Bill 66, is to modify the calculation of the “20 mill floor” by including emergency levies and school district income taxes in that tax rate.
To understand what that means and why it matters, a quick primer on relevant local tax policy is necessary. Under a longstanding state law known as “HB920 tax reduction factors,” property owners are shielded from tax increases associated with rising valuations. In other words, if a home value increases $50,000 upon reappraisal, the homeowner isn’t automatically sent a higher tax bill. Instead, the property tax rate is reduced to ensure the owners’ taxes (and school districts’ revenues) remain consistent with what was originally approved by voters.
There are exceptions, however, including when school districts’ tax rates hit the 20 mill floor.[1] At this level, rates are no longer adjusted downward even if property valuations rise. This can mean an (unvoted) tax hike for residents, as they are no longer protected by HB920 when their home values rise. From a district perspective, this means that increases in property values actually translate to more dollars coming into their coffers.
This creates a strong incentive for districts to tax at the 20 mill floor, so they can capture inflation-driven property tax revenue. Yet a district might want to further enhance their revenues by seeking voter approval for a higher tax rate. Passing an ordinary operating levy would cause its tax rate to rise, which would in turn eliminate its ability to capture inflationary revenues.
But there’s a loophole: Under current policy, certain taxes are excluded from the 20 mill calculation. One of those exceptions is emergency levies, while the other is school district income taxes. As a Fordham-Bellwether report once put it:
This allows savvy districts to have their cake and eat it, too, raising additional revenue through increased tax rates while also ensuring the district will benefit from increases in taxable property value.
Indeed, many districts seem to be strategically using the 20 mill floor and excluded levies to generate extra tax revenue. According to the Legislative Service Commission, 418 school districts were at the 20 mill tax floor in 2023 (roughly two in three statewide). Of those districts, 209 had passed an emergency levy,[2] while 192 districts had a voter-approved income tax (some imposed both). Committee testimony suggests that these numbers do indeed reflect a strategic exploitation of the loophole. As one county auditor put it, “Some school districts became familiar with the nuances of the 20-mill floor calculation and designed their funding and budgets to maximize HB 920’s loopholes.”
The sketchiness of the “emergency” levy makes the exploitation all the worse. For one, a district need not be in official fiscal emergency to put this type of levy on the ballot—and just one district is in such status. All districts have to show is that an emergency levy is needed to “avoid an operating deficit.” The broad language opens the door to budget projections that yield deficits on paper, even though in reality a district has the ability to balance its budget. The potentially misleading and alarmist language could also unfairly tip the scales in favor of the tax request, as voters are led to perceive a greater urgency to approve the levy than actually exists.
SB66 would curtail this type of gamesmanship by including emergency levies and school district income taxes[3] in the 20 mill floor calculation. This would have the following benefits.
First, by moving some districts off the floor through inclusion of excluded taxes, the bill would extend taxpayer protections to more Ohioans. Citizens living in districts with rates above 20 mills benefit from HB920 tax reduction factors, while residents in 20 mill districts get socked with an unvoted tax increase when their property values rise. That’s hardly fair. SB66 would be a step toward a system that applies HB920 more evenly across the state.
Second, the bill would promote local accountability. Instead of being able to count on automatic revenue increases when valuations rise, school districts would need to periodically convince voters to approve revenue enhancements. Tax referenda serve as an important accountability check on schools, but this process can be circumvented when districts sit at the 20 mill floor.
Third, SB66 would discourage emergency levies. By counting them in the 20 mills, districts would be less likely to resort to a questionable emergency levy simply to maintain their position at the floor. Instead, districts would be more likely to pursue conventional, neutrally-framed operating levies that are fairer and more transparent to voters.[4]
There are big problems that need to be resolved in Ohio’s school funding system. This applies to both the state funding formula and local taxes. While not a wide-ranging bill, SB66 proposes an important step toward a fairer and more accountable local tax system.
[1] The other notable exception is that tax reduction factors do not apply to school districts’ inside millage, which refers to taxes that local governments, including districts and other municipal agencies, may levy without voter approval (subject to a 10 mill limit). On average, districts levied 4.7 inside mills in FY23, while their average overall effective tax rate was 33.9 mills (3.39 percent).
[2] Or a “substitute” levy, which extends an emergency levy after its initial term was slated to expire.
[3] LSC’s bill analysis suggests that the proposed inclusion of the income tax may not pass constitutional muster (there is language about floors applying to taxes on land and improvements).
[4] As I’ve recommended before, as did former state tax commissioner Tom Zaino recently, legislators should also tighten requirements around when districts can propose an emergency levy—an issue that isn’t addressed in SB66.
Under the leadership of Governor DeWine, Ohio has invested significant time, effort, and funding into expanding and improving career pathways. Well-designed pathways often include the opportunity to earn industry-recognized credentials (IRCs), which allow students to demonstrate their knowledge and skills and verify their competence via an objective, third-party measure. IRCs signal to employers that students are well-prepared. They can boost earnings and employment. And in Ohio, high school students can use IRCs as a pathway to graduation.
To determine which IRCs qualify for graduation, Ohio policymakers have established a framework that includes a review and approval process, as well as a point value system. A committee that consists of representatives from the Department of Education and Workforce (DEW), the Governor’s Office of Workforce Transformation, and professional business organizations reviews IRCs that are submitted for consideration. The current review process includes an Ohio labor market audit, an assessment of the credential’s alignment to career field technical content standards, and an analysis of industry feedback. IRCs that make the cut are assigned a point value between one and twelve. For example, within the health career field, credentials like CPR First Aid or respiratory protection are each worth one point. In that same career field, a Certified Pharmacy Technician is worth twelve points. Students can meet graduation requirements by earning a credential or group of credentials that add to at least twelve points.
DeWine’s proposed budget would overhaul this process. The bill eliminates requirements for the committee to assign a point value to each IRC and to establish the total number of points that can be used to qualify for a diploma. Instead, the committee would be required to “establish the criteria under which a student may use industry-recognized credentials to help qualify for a high school diploma.” In other words, the governor has proposed going back to the drawing board on IRCs and their applicability to graduation.
Why do this? Ohio’s current point value system doesn’t effectively identify credential value or encourage students to earn IRCs that will lead to better long-term outcomes. That’s a big problem. And due to flaws in the current system, students are accumulating IRCs that are poorly aligned with in-demand, high-value careers—credentials that won’t get them very far professionally.
Consider Table 1 below, which shows that none of the top ten credentials earned by the class of 2023 are worth twelve points. Half are worth just one point.
Table 1. Top ten credentials earned statewide by the class of 2023
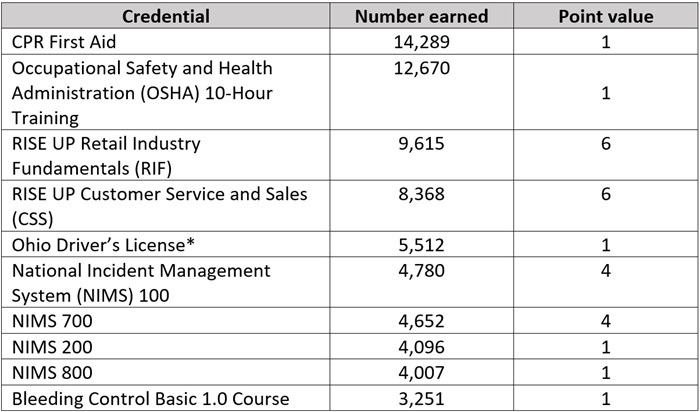
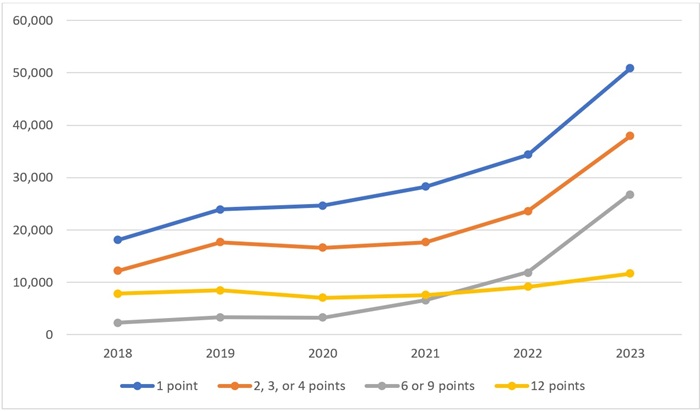
The prevalence of one-point credentials isn’t a recent development, either. Chart 2 demonstrates that credentials worth one point have consistently been the most earned since 2018. Over the last six years, the number of twelve-point IRCs being earned hasn’t increased as rapidly as the number of one-point IRCs earned. And the gap between the two has grown each year. In 2018, the gap between one-point and twelve-point credentials was just over 10,000. By 2023, it had grown to more than 39,000.
Chart 1. Credentials earned statewide according to point value, 2018–2023
Part of the reason why so many students are earning low point credentials is because they can be bundled to graduate. In fact, there’s data suggesting that Ohio’s urban districts are routing students into less rigorous IRC programs to ensure they receive diplomas. Earlier this year, my colleague Aaron Churchill analyzed the ten most commonly earned IRCs by the class of 2023 in urban districts. He found that, although hundreds of IRCs appear on the state’s approved list, attainment numbers in these districts were dominated by only a few credentials. Many of them—retail-based certificates, emergency management certificates, and one-point credentials like CPR First Aid and OSHA 10-hour job safety—don’t take much time or effort to earn and lead to industries and jobs that pay relatively low wages.
Fortunately, DeWine’s proposed budget could solve these problems—but only if the new criteria that replace the point value system are better. To ensure this happens, Ohio needs to establish a data-driven framework that identifies the impact of specific credentials on workforce outcomes and incentivizes students and schools to focus on IRCs that are truly valuable. With that in mind, lawmakers should consider adding the following provisions to the budget bill.
1. Require the committee to link credentials to wages.
If a credential doesn’t ensure that a student is financially better off for having earned it, then it shouldn’t be considered valuable by the state and shouldn’t be a pathway to graduation. Ohio’s Department of Job and Family Services already offers data search tools that outline wages by occupation and industry. It’s time to include credentials in that data, too. Students deserve to know the wages they can expect before they invest time and effort to earn a credential. School counselors and educators need access to that information so they can provide meaningful career advising. And state leaders need to ensure that state policy focuses incentives on credentials that lead to better earnings for students.
2. Require the committee to link credentials to job outlook.
The committee that oversees Ohio’s current system considers labor market data and industry feedback when deciding which credentials to approve and their point values. But the process is far from transparent. It also doesn’t give students, families, or educators access to data showing projected job growth over time and across geographic regions. Without these data, students can’t make informed decisions. Lawmakers should call on the committee to incorporate two job outlook measures in the new criteria—one that focuses on short-term demand according to feedback from industry partners, and a second that considers long-term job outlook based on projected data.
3. Require the committee to establish a three-tiered system.
The new data-driven framework should be used to assign IRCs to one of three tiers: Preferred, Valued, or Recognized. Students should be permitted to earn an IRC in any of these tiers. But only credentials that are either Valued or Preferred—those that are considered beneficial by employers, lead to well-paying jobs, and have a positive future outlook—should count toward meeting graduation requirements.
***
Over the last few years, Ohio policymakers have prioritized improving career pathways. Expanding opportunities to earn an IRC has been a key part of those efforts. The good news is that these efforts are working, and more students are earning credentials than ever before. The bad news is that Ohio’s current system doesn’t effectively identify credential value or encourage students to earn credentials that will lead to better outcomes. With his budget, Governor DeWine took an important first step toward fixing this system. But lawmakers can and should do more—including explicitly linking credentials to wages and job outlook, and establishing a tiered system that feeds into graduation requirements.
It’s no secret that improving early literacy has been Governor DeWine’s hallmark education passion. Under his leadership, Ohio is quickly moving toward the science of reading in elementary schools, and the governor’s latest budget proposal continues this push by supporting reading coaches in low-performing schools and calling for a universal diagnostic assessment in the early grades.
So far, discussions about early literacy have centered on the supports needed to launch the science of reading initiative, i.e., evidence-based practices that emphasize phonics and knowledge-building. That’s undeniably important, and lawmakers have already invested more than $150 million for professional development and curriculum overhauls. Yet as implementation continues, one of the key questions is how the state will hold schools accountable for effective implementation and improved reading outcomes.
At a basic level, the Ohio Department of Education and Workforce should check schools’ compliance with laws that now require use of an approved curriculum aligned to the science of reading. If a school is non-compliant, the agency should require immediate corrective action, including financial penalties if nothing changes.
Yet compliance can only do so much. Schools could simply check the boxes, without putting in the real effort needed to improve reading proficiency. Here’s where the school report card comes in, most notably the Early Literacy component, which first appeared in 2016. This element is supposed to hold schools accountable for reading outcomes in grades K–3, the very grades that are the primary focus of the science of reading initiative.
Unfortunately, the current structure of the Early Literacy component has a glaring shortcoming—the inclusion of fourth grade promotion rates—and Governor DeWine’s budget proposal wisely seeks to remove these data from the report card component.
As a quick refresher, Early Literacy consists of three underlying measures—third grade reading proficiency rates, fourth grade promotion rates, and an improvement rate among K–3 students deemed off-track in reading. Results are combined using a weighting system to yield a composite Early Literacy rating.
Table 1: Structure of Ohio’s Early Literacy component
There may have been some logic to including promotion rates when Ohio had a stricter third grade retention policy. But under heavy pressure from school groups—and despite evidence that the policy helped students—lawmakers gutted retention in 2023. Now schools may promote third graders who fall short of reading standards provided they receive parental sign-off.
This is an enormous loophole, and “social promotion” has indeed returned en masse across the state. In 2023–24, schools promoted an astronomical 98 percent of third graders to fourth grade, despite a statewide reading proficiency rate of just 69 percent. Some districts promoted 97, 98, 99, even 100 percent of third graders, despite less than half achieving proficiency (see, for example, Columbus, East Cleveland, Lorain, Toledo, and others).
One way to clamp down on widespread social promotion is to restore the retention requirement. But absent that, lawmakers should at least remove these wildly inflated promotion rates from the report card. The move would stop rewarding schools for advancing third graders to fourth grade in what is now a standards- and consequence-free policy environment.[1] It would also weaken the incentive currently in place for schools to push parents into approving a grade promotion, as schools would no longer get points for the percent of students promoted.
Most importantly, the governor’s proposal would—through stronger report-card-driven accountability—help focus schools on what matters most: ensuring students are proficient readers by the end of third grade and improving the literacy skills of children with reading deficiencies. To achieve these desirable outcomes, schools will need to rigorously implement the science of reading, practices that have been proven to help students learn to read.
Science of reading requirements and compliance checks are a necessary start in Ohio’s turn toward more effective literacy instruction. But strong accountability for outcomes is also critical. The governor’s proposed change to the Early Literacy component is a step in the right direction, and his colleagues in the General Assembly should approve this report card improvement.
[1] Without the artificial boost of promotional rates, the Ohio Department of Education and Workforce would likely need to adjust the “grading scale” that translates raw scores into an Early Literacy rating. Based my analysis of 2023-24 data, the removal of promotional rates from the Early Literacy calculation would lead to a one- or two-star reduction in nine out of ten districts (assuming no change in grading scale).
Last spring, Governor DeWine used his state of the state address to call on school leaders to prohibit cellphone use in the classroom. A few weeks later, lawmakers unanimously passed House Bill 250, which requires districts to adopt a policy governing the use of cellphones during school hours. DeWine signed the bill into law in May, and the Department of Education and Workforce (DEW) released a model policy a short time later. Although this model forbade student use of cellphones at all times, the law provided districts with the freedom to decide their own policies. In other words, while total bans were the state’s preferred model, they were not required.
As part of the law, districts and schools were required to have cellphone policies in place by July 1, 2025. In the waning days of 2024, DEW released the results of a survey showing that most schools had already complied. But now, thanks to DeWine’s recently released budget proposal, some schools may have to go back to the drawing board. Tucked in among a plethora of headline-grabbing changes for school choice, literacy and numeracy, and career pathways is a revision to current law that would require districts and schools to adopt a policy prohibiting all cellphone use by students during the instructional day. Should it become law, total bans would be the name of the game.
It’s important to note that the budget includes a few exceptions. First, if included in a student’s IEP or section 504 plan, students may use phones or other electronic communication devices for learning. This flexibility is crucial, because there are thousands of Ohio kids with special needs who use assistive technology. Under no circumstances should devices that children need to communicate with teachers, interact with peers, or learn in classrooms be banned from schools.
The second exception is for students who might need their phones to monitor or address a health concern. Again, this is a necessary flexibility that districts should be required to honor. The American Diabetes Association, for example, has noted that many students with diabetes use medical devices that require access to a smart phone to monitor their health and share data with school nurses and caregivers. These students, and others with health conditions, must be exempt from cellphone restrictions.
It shouldn’t come as a surprise that DeWine is attempting to strengthen Ohio’s cellphones-in-schools policy. In his 2024 state of the state address, he asserted that phones are “detrimental” to learning and students’ mental health and that “they need to be removed from the classroom.” He made similar comments in his 2025 address, saying that phones “rob our children of precious time to learn.” He cited Teays Valley Local School District, which implemented a policy requiring students to lock their phones in pouches during the school day, and noted “profound” results in areas like student engagement, attendance, grades, and discipline. “What is happening in Teays Valley,” he said, “is happening in school buildings all across Ohio that have banned phones during school hours.”
Evidence that stricter bans are having a positive impact likely strengthened DeWine’s resolve to push for legislative revisions. But results from the state’s 2024 survey gauging cellphone policy adoption and implementation probably also helped. Forty-one percent of respondents reported that cellphone use is disallowed at any time during standard school hours under their state-required policy.[1] But another 45 percent reported that student cellphone use is merely limited to selected times of the school day, such as during lunch or between classes. That means close to half of Ohio schools opted to institute partial, rather than total, bans. The 14 percent that had not yet determined their policies at the time of the survey could push the majority in either direction. But as of December, more schools were choosing partial bans.
The governor’s budget proposal would require these schools to rework their policies—but only if lawmakers in the House and Senate get on board. Right now, it’s unclear if they will. Some might feel it’s too soon to make tweaks to legislation that they unanimously passed less than a year ago. Others could have concerns about parent pushback, of which there has been plenty. As is always the case during budget season, only time will tell. But for right now, kudos to Governor DeWine for standing firm on his commitment to end cellphone distractions in schools.
[1] Ninety-eight percent of all possible respondents replied to the survey, representing 599 traditional districts, 336 charters, eight independent STEM schools, and forty-nine JVSDs.
Direct admissions (DA) programs—where colleges proactively (and preemptively) admit high school students to their institutions without the need to apply—are growing across the country. From an institutional point of view, DA serves as a buzzy recruiting tool, and it is not surprising that such programs are burgeoning in a time of reduced applications and enrollment. DA is also commonly touted as a benefit to students—especially those who would be first-generation college-goers, those lacking the “social capital” needed to navigate a complex college search, and those for whom fees or administrative requirements could be an insurmountable barrier. Does direct admission boost the likelihood that students will actually take the shortcut, accept an unsolicited admission offer, and enroll in that college? A new working paper aims to test the efficacy of DA from the student perspective.
Rather than investigating existing DA efforts, researchers Taylor Odle and Jennifer Delaney recruited six universities to participate in a new program of their own devising. The four-year schools are all anonymous but include both public and private non-profit institutions; capture a range of institutional types; and include two historically Black colleges and universities (HBCUs) and two Hispanic-serving institutions. They are located in four states in the southern and mid-Atlantic regions. All are moderately-selective to open-access institutions (60–90 percent acceptance rate across them) and serve considerable numbers of Pell-eligible students (30–80 percent of all undergraduate students, depending on the school). Average annual tuition ranges from $13,000 to $27,000. Their six-year bachelor’s degree graduation rates range from 40-70 percent. The smallest school has an undergraduate population of less than 1,000; the largest has nearly 27,000.
Participating institutions were allowed to choose a grade point average (GPA) threshold for high school students who would receive a direct admission offer (the ranges selected by the institutions varied from a 2.50 to 3.30 on a standard 4.00 scale) and how many direct admissions they would be willing to provide (these ranged from 2,000 students at one institution to an effectively unlimited number at another). No other criteria were placed on students’ admissions eligibility. All students receiving DA also received tailored information about the college, including majors available and financial aid options, a simplified form to confirm acceptance, and an automatic waiver of any fees associated with admission or enrollment.
The universe of potential college recruits came from users of the Common App online service in each of the four states. (While many DA programs are homegrown and community-centric, Common App is leading the way in expanding DA to a wider swath of states and students.) To be included in the available DA population for this experiment, students had to be high school seniors; have reported their GPA, zip code, and e-mail; have opted-in to receive communications from the Common App; and not be participating in any other Common App experiments or interventions. One third of all Common App users are first-generation college-goers, and 43 percent are from racial and ethnic minority groups. Thus these populations were widely-represented in the researchers’ samples. However, they were required to dig deeper to make sure that students from low-income backgrounds were properly represented, as the average Common App user does not fit that demographic. They ultimately identified 35,473 eligible students across the six institutions and four states, with 17,704 randomly assigned to receive treatment (a direct admission to one of the participating colleges) and the rest randomly assigned to control.
Official college acceptance letters were sent to treatment group students (and their parents or guardians if that information was available) in January of the treatment year, along with the aforementioned school information, FAQ links, and instructions on simplified next steps. Every effort was made to let officials in students’ high schools know about the authenticity of these offers to forestall concerns over a scam. Control group students received no special communication related to this experiment and pursued their application and enrollment processes (or not, as the case may be) in an organic manner. Odle and Delaney observed students’ actions through May.
On average, receiving a DA offer increased the likelihood a student applied to any college by 2.7 percentage points (or 12 percent) and by 2.8 percentage points that they applied specifically to the college that sent the DA. To put it in raw numbers: 308 control students applied to one of the researchers’ partner institutions following the distribution of DA offers (completing a full, formal, and detailed application on their own steam), compared to 829 treatment students (clicking a single button to accept the DA offer and later filling out a pared-down application document). Individual colleges saw increased likelihood of application ranging from 1.1 percent to 6.1 percent. Larger impacts on applications were seen for Black, Hispanic, and multi-racial students, as well as first-generation and low-income students who received DA offers, both to DA-offering institutions and to any college.
However—and this should be the headline—likelihood of enrollment in college (as opposed to mere application) was unchanged between treatment and control group students no matter how the data were sliced.
The null impact on enrollment underlines an important point: Attending college is a human-centric process with a lot of moving parts, not a video game that can be “cheated” with a shortcut. Any institution that is serious about boosting enrollment overall or in terms of specific subsets of students can’t stop at the equivalent of a Konami Code that jumps over admissions hoops and calls it a day. They must put in the work to meaningfully remove administrative, informational, economic, and college-going cultural barriers from the entire postsecondary experience, not just admissions. Clearly, that takes more than “click here to claim your place in college.”
SOURCE: Taylor K. Odle and Jennifer A. Delaney, “Experimental Evidence on ‘Direct Admissions’ from Four States: Impacts on College Application and Enrollment,” Annenberg Institute at Brown University (March 2025).
As a recent edition of the Journal of School Choice makes abundantly clear, modern homeschooling has changed from the traditional—perhaps even stereotypical—model of the past. Equally important: The reasons families opt for homeschooling also appear to be changing. Surveys are finding that, rather than faith or even academics, concerns about school safety are key motivators. But what exactly does this mean? New research, also from that journal edition, aims to provide details on the specific issues driving parents to embrace homeschooling today.
The research team starts with a quantitative analysis, whose findings are further illuminated via qualitative means. Quantitative data come from a long-running survey program administered by Morning Consult and the education policy nonprofit EdChoice. The program has, since January 2020, conducted monthly and nationally representative surveys of American adults on a range of issues and trends about “K–12 education ecosystems.” Among other questions, these surveys ask parents to identify the school type their children attend (options include public district, public charter, private, and homeschool). EdChoice publishes regular high-level reports on the results, but this research uses raw, individualized responses from June 2022 through March 2024. The survey began including questions on parent perceptions of school safety in June 2022, hence the specific start date. The full sample comprises 26,708 respondents who were parents with at least one child enrolled in kindergarten through twelfth grades. Among these parents, 20,057 identified themselves as having at least one child enrolled in a public school within their assigned school district, 3,052 with at least one child in private school, 2,124 with homeschooled students, 1,521 with charter school students, and 2,051 with at least one child enrolled in a public school outside their assigned district. These subcategories are not nationally representative, which is important to the findings.
The researchers obtain the qualitative data via focus groups held virtually in April 2024 with a total of thirteen participants. All were located in the same unnamed large urban metropolitan region of the southeastern United States and all had homeschooled their child (or children) for multiple years. However, only two parents had exclusively homeschooled, with the rest indicating a mix of public and private schooling. It is unclear whether any focus group participants were part of the survey sample; but as they were all recruited independently of the survey, likely not.
Quantitative findings first: Nearly half (48 percent) of the homeschooling parents surveyed selected “safe environment” as one of their three most important reasons for choosing that mode of education for their child. This number matches that of private school parents, but is nearly twice the rate of in-district public school parents who named a safe environment as a top-three reason for choosing that school type. It also is significantly larger than the number for charter school parents and out-of-district public school peers. Homeschooling parents also strongly cited individual/one-on-one attention as a factor in choosing that school type, far exceeding the rate of parents in any other school type. In deeper/more-specific responses, homeschool parents indicated less concern with physical safety (bullying, school shootings, etc.) than their peers in other sectors, but more concern with mental health and wellbeing safety issues (such as stress and anxiety), as well as what could be termed “academic deprivation.” Parents who reported having switched a child from another school type into homeschooling overwhelming cited excessive stress, bullying, and academic needs not being met—almost equally—as the primary reason for the switch. Switchers into/between non-homeschooling options cited a larger and more diffuse list of primary reasons for their switch.
The qualitative findings shed further light on parental concerns about safety. Even if they don’t have recent experience with formal education in school buildings or direct experience with physical violence occurring in them, all homeschool parents interviewed for the focus groups were well aware that events such as in-school fights, student bullying, and online threats occur. By their personal estimates, negative events are more likely to happen in those congregant settings than in smaller and more controlled settings such as meet-ups in a park or a fellow homeschooling family’s home—although participants did recall some instances of threats within such groups. The control aspect was a common refrain among parents, covering numerous areas of children’s educational experience. For one example, homeschool parents appreciated that a larger ratio of adults to children was likely to be present at any kind of student gathering than would be typical of a public or private school, thus providing a strong deterrent to misbehavior or violence. For another example, meeting special learning needs was fully in the control of homeschool parents, many of whom recounted numerous failings by public and private schools in carrying out individualized education programs. The desire for “student safety” was ubiquitous among focus group participants but was revealed as a wide-ranging and highly-personal term without common definition.
The researchers cite a few important limitations to their work, including the over-representation of students with special educational needs in both the quantitative and qualitative data, the over-representation of urban families, and the possibility that students’ perceptions of various school settings differ from their parents’ perceptions. However, it seems very clear that what is driving changes comes from experiences in and perceptions of formal schooling environments. Families are not moving toward some homeschooling paradise—but away from public and private schools whose environments are seen as uncontrolled and unsafe, no matter how those terms are defined.
SOURCE: Christy Batts, John Kristof, and Kelsie Yohe, “‘That Percentage of Safer’: A Mixed-Methods Analysis of Homeschool Parents’ Perspectives of School Safety,” Journal of School Choice (December 2024).
NOTES: Today, the Ohio Senate Education Committee heard testimony on Senate Bill 127, which would make changes to the way in which low-performing public schools are identified and how the state intervenes when schools are thus identified. Fordham’s Vice President for Ohio Policy provided this testimony on the bill.
My name is Chad Aldis, and I appreciate the committee’s continued focus on strengthening Ohio’s education system. I am here today as an interested party, but I want to be clear: with a few targeted changes, I could enthusiastically support this bill as a proponent.
As Vice President for Ohio Policy at the Thomas B. Fordham Institute, an education-focused nonprofit with offices in Columbus, Dayton, and Washington, D.C., I’m committed to policies that drive academic improvement while holding all public schools—district and charter alike—accountable for results.
Senate Bill 127 addresses a critical issue that has challenged Ohio for years—how we identify and intervene in persistently low-performing schools. I commend Chair Brenner for proposing a framework that brings consistency and clarity to this process. For too long, the state has maintained separate closure and intervention paths for traditional district schools and public charter schools, creating confusion and allowing persistently underperforming schools to struggle year after year after year. By applying a uniform standard to all 3,000+ public school buildings, Senate Bill 127 takes a significant step forward in advancing fairness, transparency, and a stronger focus on student outcomes.
The bill wisely incorporates both achievement and growth by using Performance Index (PI) and value-added (growth) data. This dual focus recognizes that when a school demonstrates both low academic achievement and a lack of student progress, it must be addressed. SB 127 does just that by requiring persistent low performers to close or adopt one of a range of structured interventions designed to improve academic outcomes. These elements reflect thoughtful policymaking.
However, I believe SB 127 can be further strengthened in three key ways:
1. Revise the growth measure to use a one-star rating instead of ranking by percentile
Under the bill as introduced, to be identified for closure or intervention, schools must rank in the bottom 5 percent statewide on Performance Index and in the bottom 10 percent on value-added. While the measures are the correct ones, the coefficient for value-added doesn’t really lend itself to a ranking. I think it would lead to inconsistent identification and would create more uncertainty than is necessary.
A better approach would align with Ohio’s existing report card system: use a one-star rating on value-added instead. This is a clearer and more stable indicator of inadequate growth, and it better reflects the state’s own definition of “low performance.” Combining this with a bottom 5 percent PI score would ensure that only schools with sustained low achievement and weak student progress are flagged—exactly as intended.
2. Apply the same identification criteria to both public school sectors—but limit intervention/restructuring to district schools
SB 127 rightly proposes uniform criteria for identifying underperforming schools across all sectors. Accountability only works when it’s fair and consistent. That said, the interventions available should reflect the fundamental differences between district and charter schools.
Public charter schools were created to be autonomous and accountable—to innovate and excel, but with the understanding that chronic failure would result in closure. They are schools of choice, not assignment. Unlike a district school, closing a charter doesn’t infringe upon the state’s constitutional obligation to provide a public education to every student in Ohio. It simply removes a poor option.
For that reason, while district schools may require flexible interventions like restructuring, charter schools should not be offered that same option. SB 127 should preserve automatic closure for chronically low-performing charters and not allow restructuring as an alternative. This keeps faith with the original charter school compact: autonomy in exchange for accountability.
3. Preserve existing years of low performance in the transition
Finally, SB 127 would reset the accountability clock by excluding report cards prior to 2024–25. This provision would essentially wipe clean one or two years of poor performance for charter schools that were already on the path to closure.
It’s vital that we maintain continuity in accountability. For existing charter schools that have already accumulated years of low performance under current law, those years should carry over into the new framework. Restarting the clock would not only reward poor performance—it would signal a step back from the high expectations Ohio has rightly established. We cannot afford to create the perception that the state is retreating from accountability and the tremendous progress that the charter school sector has made since the days of HB 2 a decade ago.
***
In closing, Senate Bill 127 is a commendable effort to unify and strengthen Ohio’s approach to persistently low-performing schools. With the adjustments I’ve outlined, it can ensure fairness across sectors while upholding high standards for all public schools. Thank you again for your leadership on this important issue, and I welcome any questions you may have.