NOTE: The Thomas B. Fordham Institute occasionally publishes guest commentaries on its blogs. The views expressed by guest authors do not necessarily reflect those of Fordham.
NOTE: The Thomas B. Fordham Institute occasionally publishes guest commentaries on its blogs. The views expressed by guest authors do not necessarily reflect those of Fordham.
Although the worst of the pandemic has passed, and the political social media chatter remains focused on the latest culture wars, the academic impacts of the unprecedented interruption to American schooling continue to be felt by Ohio students. That’s the message from the latest round of state exams taken by students this spring, according to my new report prepared for the Ohio Department of Education.
The analysis is based on preliminary results from the exams (the official results will be released later this month) and is the latest in my series ofdata deep dives designed to track the impact of the pandemic on the state’s students and their subsequent recovery.
To preview, the latest numbers underline how far Ohio students have come from the academic low point recorded in the first year of the pandemic—reflecting the dedication of our educators, the additional resources provided to local districts to support the recovery, and the determined focus of state and local policymakers. However, the tests also reveal how much work remains to be done—especially in mathematics, among older students, and in school districts hit hardest by the pandemic learning disruptions.
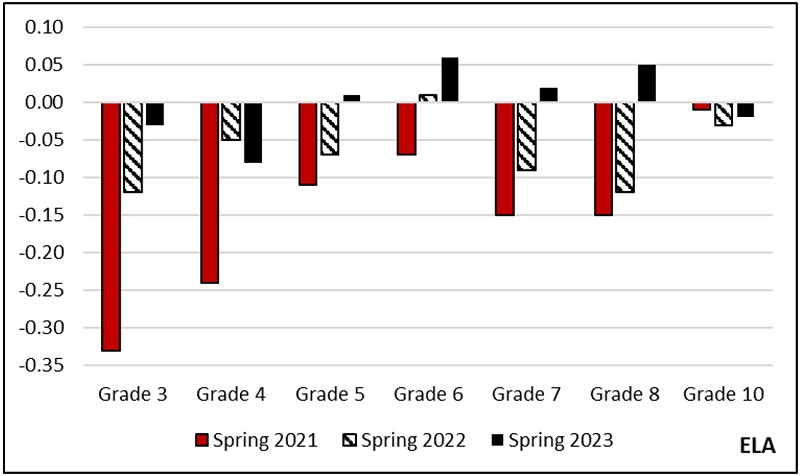
On the positive side, student achievement continued to improve over the past year, with average English/language arts (ELA) scores largely returning to pre-pandemic levels in most tested grades (or nearly so). In third grade, when students take the same ELA exam in both fall and spring, students learned 10 percent more during the 2022–23 school year than was typical before the pandemic and a big improvement on the previous year. This represents nearly double the rate of learning acceleration seen last year on national assessments and is a tremendous accomplishment that should rightly be cheered and recognized.
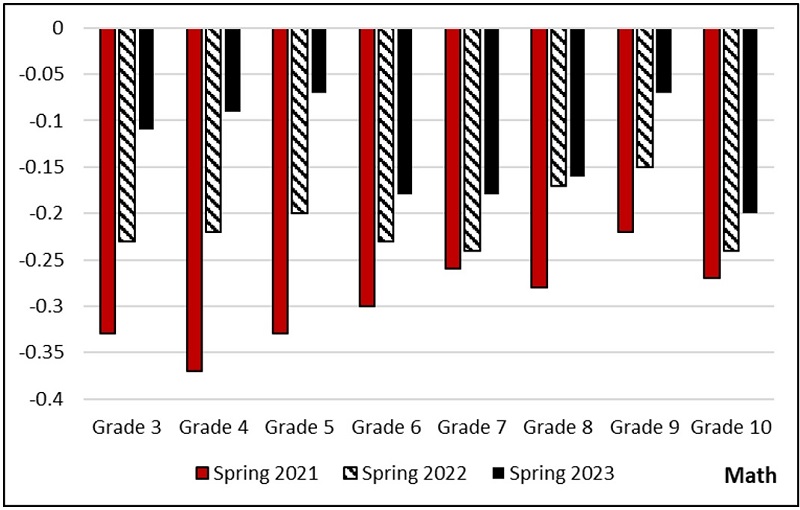
The news is more mixed in mathematics, where the test score declines were considerably larger. While elementary school students posted some catch-up growth over the past year, middle and high school students continue to perform well below pre-pandemic cohorts. And in both ELA and math, the recovery has been uneven, with Black, Hispanic and economically disadvantaged students still facing the largest shortfalls in most grades. These subgroups already lagged their peers before 2020. The gaps widened during the first year of the pandemic and remain bigger than before.
Changes in standardized scaled scores compared to pre-pandemic years, by grade and subject
Note: The figure presents the average differences in normalized test scores in standard deviation units compared to the pre-pandemic period (spring 2018 and 2019). Changes in test scores are estimated using statistical models that control for students’ demographic characteristics and school district “fixed effects.” The scaled scores are converted to Z-scores, so that effect sizes are comparable to those in other studies. The differences in normalized scaled scores can be interpreted as the change in student achievement in standard deviations. Grade 10 scores are based on the ELA II and Geometry end-of-course exams, which are not taken by all tenth graders. Grade 9 math scores are based on Algebra end-of-course exams, which some students may also take in other grades. Scores from students who took these exams in other grades are excluded from these estimates (see tables in Appendix for full results that include students in all grades for the high school exams).
My latest report contains several other new insights. First, it goes beyond math and ELA to examine both science and social studies in the grades these exams are taken. Achievement in these subjects suffered substantial declines post-Covid and has also experienced partial recovery since then. Second, in addition to describing the trend in statewide average scores, the analysis examines variation across school districts. And it is these numbers that are perhaps the most sobering.
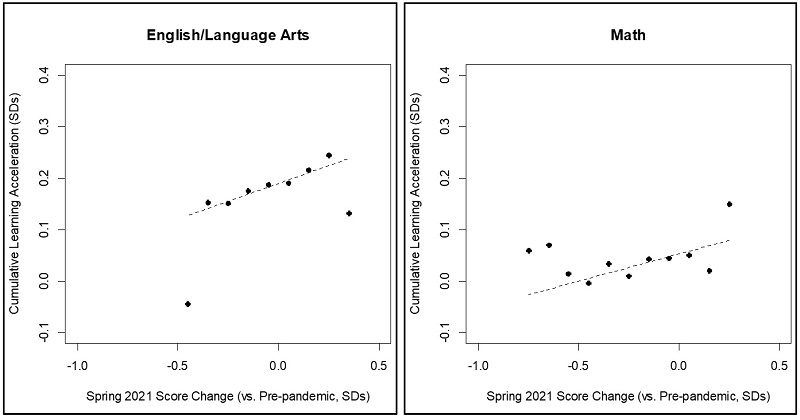
Overall, more than 90 percent of Ohio school districts have seen their achievement improve since spring 2021, the pandemic low. However, the pace of the recovery has varied considerably across different communities. Areas that showed the largest academic declines have not posted faster growth over the past two years—if anything, they seem to be recovering more slowly. This can be seen in the figure below, with districts arranged in order based on the magnitude of their initial losses. The groups on the bottom left of each panel represent districts with the largest test score declines in the first year of the pandemic. As the figures show, they have actually experienced somewhat slower learning acceleration over the past two academic years (tracked on the y-axis) than the rest, a worrying trend since they have the greatest ground to make up. In addition, districts that received the most federal pandemic aid per student have not experienced substantially faster achievement growth. (The districts whose achievement declined the most were also, in general, many of the same districts that received the largest infusion of federal funds.)
Relationship between initial achievement declines and learning acceleration since spring 2021 at the district level
Note: The figures present binned scatter plots showing the relationship between achievement declines recorded in spring 2021 by each district on the x-axes and the cumulative learning acceleration in each subject since then on the y-axes. Learning acceleration is defined as the increase in one-year growth rates relative to each district’s pre-pandemic benchmark. Both test score changes and one-year growth estimates are averaged pooling grades four through eight. The one-year acceleration estimates from spring 2022 and spring 2023 are added together to calculate the “cumulative” gains over the two-year period. The dashed line represents the ordinary least squares regression fit on the raw (unbinned) district data.
That does not mean that federal dollars have not played an important role in Ohio’s academic recovery. But the data do suggest that federal aid—the last of which must be committed by September 2024—is unlikely to be enough to close the academic gaps. It is important for policymakers to plan for the next phase of the recovery—with strategic emphasis on the subjects, grades, student subgroups, and school districts where achievement continues to show the largest shortfalls.
Over the past three years, Ohio has served as a national model in the transparency policymakers have brought to this issue. No state has kept such a close eye on the trajectory of student achievement and publicized the results in such detail, even when they have not made for pleasant reading. Willingness to track the data and confront bad news head on may explain the impressive improvement in ELA scores over this period. With continued focus from policymakers, we can continue to make further progress in preparing Ohio students for long-term success.
Vladimir Kogan is a Professor in The Ohio State University’s Department of Political Science and (by courtesy) the John Glenn College of Public Affairs. The opinions and recommendations presented in this editorial are those of the author and do not necessarily represent policy positions or views of the John Glenn College of Public Affairs, the Department of Political Science, or The Ohio State University.
The start of a new school year means that big yellow school buses are back on the road. For many, they’re a welcome sign that a familiar routine has resumed. For others, they spark nostalgia. But for district and school administrators across Ohio, the sight of a yellow bus likely spurs stress and concern thanks to widespread bus driver shortages.
Ohio’s bus driver shortage isn’t new. During the 2022–23 school year, several districts were forced to closeor transition to remote learning because there weren’t enough drivers to get students to school. In the spring, Cincinnati Public Schools announced new start and dismissal times for the upcoming 2023–24 school year in an attempt to circumvent their driver shortage. Now, with the new school year well underway, plenty of districts—including Akron Public Schools, the state’s seventh largest—are still trying to fill open positions. Doug Palmer, the senior transportation consultant for the Ohio School Boards Association, recently told the Statehouse News Bureau that although districts have revamped routes and taken other steps to address shortfalls, many are still struggling. Things get especially sticky when the drivers that districts do have are sick or unavailable because there isn’t a reliable pool of substitutes to step in.
For the average Ohioan—especially those who don’t rely on buses to get their kids to school every day—school transportation woes might not seem like an urgent problem. But it’s important to recognize just how disruptive bus driver shortages can be. As Palmer points out to the Statehouse News Bureau, they can negatively impact student learning. Fewer bus drivers mean longer routes and increased delays, which lead to kids arriving to school hours late and missing out on valuable instructional time. In fact, at some charter schools, students have missed entire days because their district-provided buses just never showed up. Given the lingering effects of the pandemic on student learning, that’s something schools can’t afford. On the flip side, parents can’t rely on buses to return kids home in a timely or consistent fashion, which disrupts childcare and creates scheduling conflicts. Even if kids do get to school on time, a lack of drivers can force students to miss out on field trips and extracurricular activities because the district can’t provide transportation.
It’s imperative for districts to identify the factors driving shortages and address them. At least one of those factors is fairly obvious. Professional drivers now have a plethora of employment options, including Amazon, UPS, and FedEx—companies that typically offer better pay. But it’s not just wages that draw away veteran drivers or make it difficult for districts to recruit new ones. It’s also the lack of hours and stability offered by school districts, which typically assign morning and afternoon routes and nothing else. That leaves a huge chunk of the day when drivers have nothing to do and thus aren’t making any money. Because districts begin dismissal as early as two or three o’clock, there isn’t time for drivers to find a second job to fill those empty hours. Even worse, some districts use these limited hours to restrict employee benefits and save themselves some cash. Since drivers technically aren’t working a full day, they often aren’t eligible for the lowest cost healthcare options. If schools are failing to offer competitive wages, full-time hours, and healthcare, then it’s not hard to see why drivers might choose to go elsewhere.
Unfortunately, there’s no silver bullet solution. But a provision included in the recently passed state budget that requires the Department of Education and Workforce to develop a “bus driver flex career path model” could help districts get on the right path. The model will create a pathway that allows bus drivers to complete either a morning or afternoon bus route and spend the rest of the day working at a school as an educational aide or student monitor. The Department must ensure that bus drivers are working an eight- to ten-hour shift, which gives them full-time employee status and all it entails—including more pay and covered healthcare. The Department must also ensure that the model doesn’t “adversely impact” a bus driver’s pension. That’s an important stipulation, as the guaranteed-for-life nature of pensions is often considered more attractive than other retirement options and could be leveraged in recruitment efforts.
As my colleague Jeff Murray noted in his initial coverage of this model, it could be a win-win for schools if implemented well. Not only would it help districts recruit more drivers, it would also give them “more hands” in schools to help with student and building needs. Obviously, things like offering competitive wages and paying for training still matter. But if this model is implemented along with a plethora of other strategies, it could help turn the tide.
Career and technical education (CTE) was a huge priority for Ohio lawmakers during the recent budget cycle. Over the next biennium, the state will invest hundreds of millions to support the expansion of CTE programming and cover the cost of upgrading facilities and equipment. This influx of cash should help modernize and expand Ohio’s CTE programs. But the state’s investment extends beyond just funding. The budget also included some important policy changes, namely a provision that allows school districts to partner with Ohio Technical Centers (OTCs) to provide students in grades 7–12 with CTE courses.
To understand the thought behind this provision, as well as its potential impact, some background about Ohio’s CTE sector is necessary. At the post-secondary level, a good portion of the state’s CTE programming is delivered by OTCs—independently operated, state-funded CTE providers that are distinct from community colleges and offer adults technical education services, training, and credentials for in-demand jobs. At the secondary level, CTE courses are offered to middle and high school students via Career-Technical Planning Districts (CTPDs), of which there are three types:
In comprehensive CTPDs, students participate in CTE programming at their local high school or in a separate CTE-specific building. In both cases, the building is governed and operated by the district school board and its superintendent.
In compact CTPDs, a group of districts work together to offer CTE programming. Students who attend these districts and enroll in CTE programs spend a portion of their school day attending classes at their local high school, and spend their remaining time at whichever high school within the compact offers their chosen CTE program. Buildings are operated by the district in which they are located, but the compact CTPD itself is managed by one lead district which is responsible for federal and state accountability measures.
Joint Vocational School Districts (JVSD) exclusively offer CTE programming. They serve two or more adjacent school districts, but are governed by their own board of education and thus operate as their own independent district. Students who attend one of the districts served by a JVSD can attend the JVSD either full or part time.
Since 2014, state law has required every public school district to ensure that students in grades 7–12 have access to CTE programming in state-approved career fields. Districts meet this requirement through comprehensive and compact CTPDs or JVSDs. Charter and STEM schools that serve students in grades 7–12 are assigned to a CTPD by the state. As a result, every middle and high schooler who attends a public school in Ohio has access to CTE in some way, shape, or form. That’s the good news.
The bad news is that the breadth and depth of student access varies widely. Sometimes, districts don’t have the facilities and/or equipment to offer certain courses. This can limit the programs and career pathways that are available to students. Furthermore, recently published state data indicate that CTE is an area of concern in regard to teacher shortages. If districts and JVSDs are struggling to find qualified instructors, they may have to limit which courses and programs they offer. Add to that the complexity of course scheduling (if a CTE course is offered at the same time as another course that a student needs to graduate, they’re likely not going to choose the CTE course) and capacity restraints (if there are fifteen slots available for a specific a course and twenty students are interested in enrolling, then five students are going to be out of luck), and it becomes clear that plenty of students are missing out on valuable CTE opportunities despite state policy mandating CTE access.
This is where OTCs come into play. Because they share the same primary mission as CTPDs—offering high-quality CTE programming in in-demand fields—they are uniquely qualified to help CTPDs fill access gaps. In fact, most OTCs are co-located with and co-governed by CTPDs (specifically JVSDs). The budget leverages the shared mission and existing relationships by permitting traditional districts and JVSDs to contract with an OTC to serve students in grades 7–12 who are enrolled in a CTE program at the district but are unable to take a desired or needed course for any number of reasons.
Districts are required to apply to the Department of Education and Workforce for approval to contract with an OTC. In a nod to the intent behind the policy change, the law requires the department to “consider the extent to which the partnership will increase access to career-technical education courses for students” prior to approving any application. Once approved, districts will be required to award students high school credit for completing any CTE course at an OTC. Districts must also pay OTCs for each student who takes a course, and may use CTE program funding to do so.
As is typically the case, implementation will make or break this policy. If OTCs and districts work together and put students first, the average middle and high schooler could soon have access to a much larger number of CTE courses. Improved access could result not just in increased participation, but also better outcomes. More students could earn meaningful industry-recognized credentials and get their foot in the door at well-paying jobs and post-secondary institutions. That would be a win-win for students, schools, and employers. Here’s hoping that districts and OTCs are up for the challenge.
At the same time that the number of degree earners in the U.S. was increasing—from about 1.24 million graduates at four-year institutions in 2001 to about 1.98 million graduates in 2018—students were also taking longer and longer to complete those “four year” degrees, driving up costs and raising the risk of non-completion for even the most able students. The reasons are myriad, but in the mid-2010s, universities across the country began adding a new support, called “completion grants,” to help speed up such students and get as many near-completers across the degree finish line as possible. A new study looks at the impacts of this intervention.
Completion grants are aimed at a specific subset of students who are near degree completion but experiencing a financial burden likely to either slow down their progress or force them to dropout altogether. Georgia State University’s Panther Retention Grants, started in 2011, are the genesis of the model. It has since spread to institutions across the country, with programs funded by private donors, state government, and philanthropic organizations.
The researchers conducted a randomized-controlled trial of the efficacy of completion grant programs at a group of eleven public institutions that are open- and broad-access. The schools are located in ten different states and average 25,000 undergraduates each. In 2019, the average four- and six-year graduation rates among them in 2018 were just 30 percent and 56 percent, respectively. And the average cost of attendance for in-state students was just over $25,000 a year, with half of all students using federal loans to pay for college.
The schools’ grant programs were independently operated but shared broad similarities. Students did not apply for the grants. Rather the money was awarded based on administrative records indicating that students were near completion (having earned at least 75 percent of the credits required for their degree) and had unmet financial need, as defined by a balance due to the institution or a shortfall of funding for living expenses. Other eligibility requirements included FAFSA completion, an Expected Family Contribution of $10,000 or less (that is, within 200 percent of Pell Grant eligibility), compliance with satisfactory academic progress requirements as defined by the institution, in-state residency, and a current course load of at least six credits.
Using these criteria, the institutions identified 14,226 eligible students in summer 2018. They conducted a random lottery with separate draws for Pell recipient and non-recipient students. Across universities, 2,231 students (16 percent of those identified as eligible) were selected to receive grants. The remainder formed a control group receiving no additional funds. The average grantee received approximately $1,200, with the highest award totaling $3,000. Funds were awarded for up to one academic year, with some institutions awarding the full grant in the fall and others splitting it up between fall and spring semesters. Grants were automatically distributed without any action required of students, and were received no later than two weeks following the start of term. Communications to students stressed that no repayment of funds would ever be required. More on that below.
The researchers measured degree progression for all 14,226 eligible students—recipients and non-recipients alike—for three years following distribution of the funds. On the retention side, 95 percent of all students identified as eligible for a grant graduated or remained enrolled within three years, with or without receiving a grant. As for completion—the intended goal of the program—two-thirds of all those who did not drop out went on to complete degrees. However, the vast majority of completers (89 percent) took two further academic years to do so. Not exactly a fast track. There was no statistically-significant difference between grant recipients and non-recipients in terms of completing a four-year degree or the time needed to earn such a degree. At best, grant recipients saw a 1 percentage point higher rate of retention in the first year than their non-recipient peers, a barely-significant boost that also quickly dissipated in the following years. Additionally, there were no differential impacts observed for low-income students or racial or ethnic minority students as compared to their higher-income and white peers.
The data are clear that completion grants as operationalized in these universities do not provide the intended benefits but offer no clarity on why that is case. The researchers point to student survey responses, which indicate a lack of understanding among grant recipients as to why they received the funds (and ignorance among a small number of respondents that they received any additional money at all), despite the detailed communication provided. The implication: If students don’t know that they are being incentivized to finish (and to do so expeditiously), they experience no additional motivation to do either. The researchers also suggest that the no-requirements, “free money” award process actually plays into the lack of understanding among recipients. They recommend a more active completion grant model, involving more and better communication, as well as engaging more directly with eligible students, such as via deans or counselors. It could also be that there is more than just financial concern standing between these near-completers and the degree finish line—changing majors, excess electives, family commitments, etc.—and that no amount of money would be enough to overcome them.
Future Forward began in Milwaukee in 2005 as SPARK—a small-scale, local effort to combine family engagement with intensive tutoring to help low-income elementary-age students improve their literacy skills. It has since expanded significantly, rebranded, and moved under the aegis of national nonprofit Education Analytics, Inc. The SPARK pilot has been studied extensively, and a new report, from researchers at the University of Wisconsin-Milwaukee, gives us the most comprehensive analysis yet.
This analysis extends previously-published research, following 576 students who were entering kindergarten, first grade, and second grade in seven Milwaukee Public Schools in fall 2013. The children, nearly all of them Black or Latino, were randomly assigned to receive either two years of Future Forward literacy intervention along with traditional business-as-usual reading instruction, or simply business-as-usual instruction. Students with IEPs were excluded from the analysis (except for one child with a speech-language plan), as were English learner students. Those in the treatment group were offered thirty minutes of phonics-focused, one-on-one tutoring from a paraprofessional or trained volunteer three times each week via pullouts from noncore classes. Informal learning opportunities were also included in afterschool programming provided by the Boys and Girls Clubs of Greater Milwaukee. But the program’s most innovative aspect was family engagement, which included regular communication from an engagement coordinator (typically another school parent) about the child’s progress, home visits where parents were provided with “development opportunities” that could help their child’s literacy growth during the school year and in the summer, plus monthly community events that included learning opportunities, as well as fun activities to attract families.
The prior research study found that, after two years of active participation—comprising an average of thirty hours of in-school tutoring actually attended per student per year, sustained communication to parents, dozens of community events, hundreds of home visits, and two years of afterschool opportunities—treatment group students saw positive impacts on foundational literacy, reading achievement,, and school attendance. The impacts were greatest for students starting at the lowest levels of reading skills. So far so good.
The new analysis follows the original participants for five years beyond the end of the active treatment, through winter 2020 when children were in middle school. Attrition occurred in both treatment and control groups due to students moving out of state or switching to private schools, but the researchers note that the percentages are within the norms set by the What Works Clearinghouse to avoid attrition bias. Data are provided using the same sources as previously, although the district did change its reading assessment vendor beginning in 2015–16. The nationally-normed scores were converted to grade level equivalents to allow direct comparison to previous scores.
Treatment students continued to notch higher test scores than their control group peers through middle school. However, positive impacts were now concentrated around students who had started SPARK at the highest levels of reading skills, reversing the trends observed during active treatment and providing solid evidence of a fading out of effects, at least for certain students. Furthermore, one year after active treatment, Future Forward students were almost exactly at grade level in reading (0.03 years below), while control group students were 0.29 years below. However, five years after active treatment, the typical Future Forward student was reading 2.03 years below grade level, and even those who had started at a higher skill level were reading 1.17 years below. The situation was even more dire for control group students, with the worst performers reading more than three years below grade level. Neither is desirable, but at least participants did not fare as poorly as their non-participant peers.
Another tiny bright spot: The average Fast Forward student whose attendance data could be reliably tracked across all years under study recorded 5.9 fewer absences than the average control student. However, the researchers suggest that the incomplete data for a large number of students could be skewing those results. These positive effects were also concentrated among students who started at the higher end of the literacy skills distribution. No discussion is provided about possible mechanisms at work here.
These findings accord with similar analyses over the years of HeadStart, Success for All, and kindred interventions for disadvantaged young children: early positive impacts that begin fading out in one or two years. And if the educational systems in which students spend the rest of their primary and secondary education are underperforming, no amount of early boost will get them—and keep them—on par with their more-advantaged peers. The authors conclude here that it is unreasonable “to expect time- and resource-limited programs to fundamentally transform the educational terrain,” and that their findings “highlight the need for systemic change.” Programs like Future Forward are part of the solution, but are not sufficient on their own, even with the addition of home- and community-based efforts.
As has been widely reported, students in Ohio and across the nation suffered major setbacks during the pandemic. Between 2019 and 2022, Ohio students lost on average the equivalent of roughly one-half grade-level of learning. The learning losses were even more severe in urban communities, thus widening the state’s already-massive achievement gaps between less advantaged students and their peers.
Another round of state assessment data is set for release in mid-September. What will the latest data tell us about student progress over the past school year? Have students caught up to pre-pandemic levels? Or is there still much work ahead to help students recover?
Please join Ohio Excels and the Thomas B. Fordham Institute for an in-person event onSeptember 19thin Columbus. Dr. Vlad Kogan of Ohio State University will present findings from his new analyses of 2022–23 state assessment results. A panel discussion will follow that touches on implications for policy and practice.
Today, the Thomas B. Fordham Institute announced that Dr. Stéphane Lavertu will join the Institute as a Senior Research Fellow. Dr. Lavertu is a professor at The Ohio State University’s John Glenn College of Public Affairs, and has conducted numerous studies on education governance, school accountability policies, and public- and private-school choice programs. For the Fordham Institute, he has completed rigorous, Ohio-focused analyses about the impacts of school closure, interdistrict open enrollment, public charter schools, and the EdChoice scholarship.
“Professor Lavertu is a renowned scholar and has a prodigious track record of producing studies that stand up to academic scrutiny,” said Chad L. Aldis, Vice President for Ohio Policy at the Thomas B. Fordham Institute. “Too often, policy debates get muddled by anecdote and inappropriate uses of data. Through his skilled application of rigorous methods, Professor Lavertu has already shined a clearer light on the effectiveness of various policies and programs in Ohio. We are exceptionally pleased that he’ll continue to help drive a data-driven approach to education policy as Senior Research Fellow for the Fordham Institute.”
As Senior Research Fellow, Lavertu will conduct original research on K-12 education in Ohio, as well as contribute occasional commentary for the Institute’s Ohio Gadfly newsletter. Professor Lavertu will continue his role in the John Glenn College of Public Affairs.
“I’ve long appreciated the Fordham Institute’s role in bringing rigorous evidence to bear on policy debates,” said Dr. Stéphane Lavertu. “It’s all about providing Ohio’s kids the best opportunity to succeed. Working more closely together will enable us to further bridge the divide between cutting-edge academic research and policymaking.”
Dr. Lavertu’s scholarly work has appeared in peer-reviewed publications such as the Journal of Public Economics, American Political Science Review, and Educational Evaluation and Policy Analysis. He earned degrees from The Ohio State University, Stanford University, and the University of Wisconsin-Madison.