Mobile Navigation

  • National
    • Policy
      • High Expectations
      • Quality Choices
      • Personalized Pathways
    • Research
    • Commentary
      • Gadfly Newsletter
      • Flypaper Blog
    • Events
    • Scholars Program
  • Ohio
    • Policy
      • Priorities
      • Media & Testimony
    • Research
    • Commentary
      • Ohio Education Gadfly Biweekly
      • Ohio Gadfly Daily
  • Charter Authorizing
    • Application
    • Sponsored Schools
    • Resources
  • About
    • Mission
    • Board
    • Staff
    • Career
Home
Home
Advancing Educational Excellence

Main Navigation

  • National
  • Ohio
  • Charter Authorizing
  • About

Ohio Menu

  • Topics
    • Accountability & Testing
    • Advanced Education
    • Career & Technical Education
    • Charter Schools
    • Curriculum & Instruction
    • ESSA
    • Evidence-Based Learning
    • Governance
    • Personalized Learning
    • Private School Choice
    • School Finance
    • Standards
    • Teachers & School Leaders
  • Research
  • Policy
  • Commentary
    • Ohio Gadfly Newsletter
    • Ohio Gadfly Blog
    • Events

The Education Gadfly Weekly

Sign Up to Receive Fordham Updates

We'll send you quality research, commentary, analysis, and news on the education issues you care about.
Thank you for signing up!
Please check your email to confirm the subscription.

Ohio Gadfly Biweekly—Spring tests show achievement suffered; spotlight in-person learning

Volume 15, Number 19
9.7.2021
9.7.2021

Ohio Gadfly Biweekly—Spring tests show achievement suffered; spotlight in-person learning

Volume 15, Number 19
view
Guest commentary Kogan Lavertu image
Standards & Accountability

Ohio’s 2021 spring tests show that achievement suffered during the pandemic and highlight the importance of in-person learning

NOTE: The Thomas B. Fordham Institute occasionally publishes guest commentaries on its blogs. The views expressed by guest authors do not necessarily reflect those of Fordham.

Vladimir Kogan, Stéphane Lavertu 9.7.2021
OhioOhio Gadfly Daily

Ohio’s 2021 spring tests show that achievement suffered during the pandemic and highlight the importance of in-person learning

Vladimir Kogan | Stéphane Lavertu
9.7.2021
Ohio Gadfly Daily

An overview of Ohio’s new school funding formula, and a look at whether it might stick

Aaron Churchill
9.7.2021
Ohio Gadfly Daily

A bright future for open enrollment

Matthew Ladner
8.27.2021
Flypaper

NWEA measures the impact of the pandemic on student achievement and growth

Jessica Poiner
9.2.2021
Flypaper

A downbeat assessment of students’ mental and social-emotional health in the Covid era

Jeff Murray
9.2.2021
Flypaper

Do Ohio’s early high achievers stay strong?

9.7.2021
Event
view
Will Ohio new formula stick blog image

An overview of Ohio’s new school funding formula, and a look at whether it might stick

Aaron Churchill 9.7.2021
Ohio Gadfly Daily
view

A bright future for open enrollment

Matthew Ladner 8.27.2021
Flypaper
view

NWEA measures the impact of the pandemic on student achievement and growth

Jessica Poiner 9.2.2021
Flypaper
view

A downbeat assessment of students’ mental and social-emotional health in the Covid era

Jeff Murray 9.2.2021
Flypaper
view
OH Gifted Report banner

Do Ohio’s early high achievers stay strong?

9.7.2021
Event
view
Guest commentary Kogan Lavertu image

Ohio’s 2021 spring tests show that achievement suffered during the pandemic and highlight the importance of in-person learning

Vladimir Kogan | Stéphane Lavertu
9.7.2021
Ohio Gadfly Daily

NOTE: The Thomas B. Fordham Institute occasionally publishes guest commentaries on its blogs. The views expressed by guest authors do not necessarily reflect those of Fordham.

The Covid-19 pandemic caused unprecedented disruptions to teaching and learning in Ohio, including school closures, sudden changes to instructional delivery, economic hardship, and social isolation. In January 2021, we released a report that examined the impact of the pandemic on Ohio students’ achievement, as measured by the fall 2020 administration of Ohio’s third grade English language arts (ELA) exam. That study documented significant declines in achievement relative to student performance on the same test prior to the pandemic—especially among traditionally disadvantaged students and students whose districts opted for remote instruction.

Ohio’s public officials—from Governor DeWine to school administrators—sought to stem the achievement decline by expediting a return to in-person learning and implementing learning recovery plans. For example, many districts expanded their summer school offerings and supported students by providing computers and Wi-Fi, tracking down those chronically absent, and coordinating a variety of social services. Importantly, and in spite of significant resistance, Ohio’s governor and legislators were determined to administer state tests in spring of 2021 in order to monitor student learning, identify student populations that continue to struggle, and determine what educational and administrative practices work.

Our new report, examining student performance on Ohio state tests from this past spring, demonstrates the tremendous insights state assessments provide about the educational progress of Ohio students. Unlike data released in other states in recent weeks, our analysis carefully accounts for the lower-than-usual rates of student test participation. Because disadvantaged students who tend to be low-achieving were those least likely to take state exams this past spring, naïve estimates that fail to account for low participation rates significantly understate learning declines. Our analysis addresses this problem. We also take advantage of Ohio’s rich data to document differences in learning impacts across student subgroups and assesses the consequences of different district educational delivery models.

Thus, once again, Ohio sets itself apart with its commitment to bringing the very best evidence to bear on state and local education decision-making. Specifically, our report uses Ohio’s detailed student-level data to do the following:

  1. Examine if schools have been able to make up ground lost between March and November of 2020 by estimating student learning growth from November 2020 to April 2021 on third-grade ELA exams. This analysis helps isolate the learning disruptions that have taken place since the beginning of the school year, separating their impacts from closures and other disruptions in the spring of 2020.

  2. Estimate the total impact of the pandemic—from March 2020 to April 2021—in grades 5–8 and high school in both ELA and math. This analysis focuses on how much progress students have made in achievement over this entire time span and examines differences in learning disruption across student populations and modes of instruction.

Below, we highlight some major findings from our analysis. We encourage readers to consult the report for a more complete set of results. 

1. Achievement declines continued during the 2020-21 academic year.

As we reported previously, the fall 2020 third-grade ELA exams indicated that Ohio third graders fell behind due to Covid-related disruptions from spring to fall of 2020. The spring 2021 tests reveal that these third graders did not catch up during the remainder of the 2020–21 school year. Instead, they continued to lose ground compared to previous cohorts of students.

Specifically, in ELA, third-grade students learned roughly 20 percent less on average between November 2020 and April 2021 as compared to students in prior years. Indeed, as of spring 2021, at least one third of the total pandemic-related achievement decline on third-grade ELA exams is due to decreased growth during the 2020–21 academic year. The remainder is due to declines that took place prior to the fall testing window (including but not limited to school closures in spring 2020).

We found similar overall impacts across all of the grades we examined. The total decline in student achievement in spring 2021 compared to prior years was roughly equivalent to between one-half and a whole year’s worth of learning in math and between one-third and one-half of a year’s worth of learning in ELA, depending on the grade level. In most grades, ELA proficiency rates decreased by about 8 percentage points and math proficiency decreased by approximately 15 percentage points.


2. Remote instruction is to blame for a significant portion of student learning declines.

Students in districts that spent the majority of the academic year using fully in-person instruction experienced smaller achievement declines than students in districts using either hybrid or virtual learning. These differences across modes of learning were somewhat more pronounced in lower grades compared to higher grades and in ELA compared to math. In ELA, districts with fully remote instruction for most of the year recorded test score declines 2–3 times larger, depending on the grade level, than districts that spent the majority of the year fully in person.

Our analysis of fall-to-spring achievement growth on the third-grade ELA test—as well as Ohio’s data on district mode of learning—confirms that this correlation between district mode of instruction and student achievement likely captures a real difference in the effectiveness of in-person and remote modes of instruction. We estimate that students had learning declines almost twice as large with remote instruction as compared to in-person instruction (-0.19 standard deviations instead of -0.10 standard deviations; see Figure 1).

Figure 1. Changes in fall-to-spring standardized test score growth on Ohio’s third-grade ELA exam in 2020–21 compared to pre-pandemic years, by district mode of instruction

Guest commentary Kogan Lavertu figure 1​

Note: The figure presents the average fall-to-spring growth of normalized test scores in standard deviation units between pre-pandemic years (2018 and 2019) and 2021. These are regression estimates that compare changes in test scores over time for students who took the same exam in fall and spring of each year. Mode of instruction is determined based on weekly data submitted to the Ohio Department of Education for weeks between the fall and spring test administration windows. Due to changes in how mode of instruction was recorded over the course of the year, the “hybrid” category combines districts that offered fully hybrid instruction across all grades and districts that offered at least some in-person instruction for lower grades and remote instruction for older students.


3. Disadvantaged students were most negatively affected by the pandemic, further exacerbating achievement gaps.

Compared to their peers, historically underserved student subgroups (measured by race, economic status, homelessness, disability, and English-learner status) generally experienced test score declines that were 1.5–2 times larger in ELA compared to their peers. The analysis of fall-to-spring achievement growth on the third-grade ELA exam is particularly enlightening. For example, students who performed in the highest quartile of achievement in the fall learned as much between fall and spring of the 2020–21 school year as they did in years prior to the pandemic. Those in the bottom achievement quartile, however, learned about 25 percent less than usual. This difference is highly consequential because third-grade students in the bottom quartile typically experience two to three times more learning growth during the school year than students in the top achievement quartile. 


4. Contrary to popular belief, students in later grades experienced the greatest learning declines relative to typical achievement growth rates.

In contrast to recent analyses examining achievement trends on district-administered assessments, we find little evidence that student achievement growth declined most in lower grades. Indeed, relative to typical achievement growth in each grade, students in upper-middle school and high school have fallen behind more than students in lower-middle and elementary grades. The greater decline in later grades is particularly due to greater declines in math.

For example, between 2019 and 2021, fifth graders had test score declines of 0.34 standard deviations in math compared to prior cohorts, whereas students who took the high school geometry exam (usually in tenth grade) had test score declines of 0.29 standard deviations. It appears, then, that there were larger declines in earlier grades. However, younger students typically learn a lot more from year to year than older students. When we compare the raw test score declines to typical achievement growth in those grades, students in fifth grade fell behind the equivalent of just over half of a year of learning, whereas students who took the high school geometry test were behind the equivalent of a full year’s worth of learning. Other studies’ failure to account for differences in the amount of typical achievement growth across grade levels has led to considerable confusion and, perhaps, a failure to target interventions appropriately.

Our findings—in conjunction with emerging research on the social-emotional impacts of distance learning and student isolation—make very clear that, typically, students learn much better when they can attend school in person. The academic literature also indicates that this is particularly true for low-achieving and disadvantaged students. The surge in Covid-19 cases due to the delta variant might tempt policymakers to rethink in-person instruction. Our analysis confirms that would be a bad idea for most Ohio students, and likely those throughout the nation. It is important to balance the serious near-term public health concerns posed by the more highly contagious form of the virus against the long-term impacts of learning disruptions—particularly since these disruptions have affected disadvantaged communities the most. 

Our focus needs to be on opening schools as safely as possible—and making sure they can stay open. Districts leaders should make every effort to implement layered mitigation strategies that we saw work so well during the last academic year and develop proactive testing and other approaches to minimize further disruptions from quarantines, which have already had a devastating effect on student learning. But more than simply prioritizing in-person instruction, we must ensure that students, especially those who have suffered the most learning loss, are getting the supports that they need to get back on track. 

Vladimir Kogan is Associate Professor in The Ohio State University’s Department of Political Science and (by courtesy) the John Glenn College of Public Affairs. Stéphane Lavertu is Professor in The Ohio State University’s John Glenn College of Public Affairs. The opinions and recommendations presented in this editorial are those of the authors and do not necessarily represent policy positions or views of the John Glenn College of Public Affairs, the Department of Political Science, or The Ohio State University.

view
Will Ohio new formula stick blog image

An overview of Ohio’s new school funding formula, and a look at whether it might stick

Aaron Churchill
9.7.2021
Ohio Gadfly Daily

At the end of June, Ohio lawmakers passed House Bill 110, the biennial operating budget for FYs 2022–23. It included a new school funding framework that received bipartisan support and was backed by school district officials and teachers unions. But formulas don’t always have a long shelf life; this will be Ohio’s fourth within the past fifteen years. So will this framework stick, or will it suffer the same fate as prior ones? There are reasons to believe that future lawmakers will stay with this model, but some causes for doubt, too.

The new approach

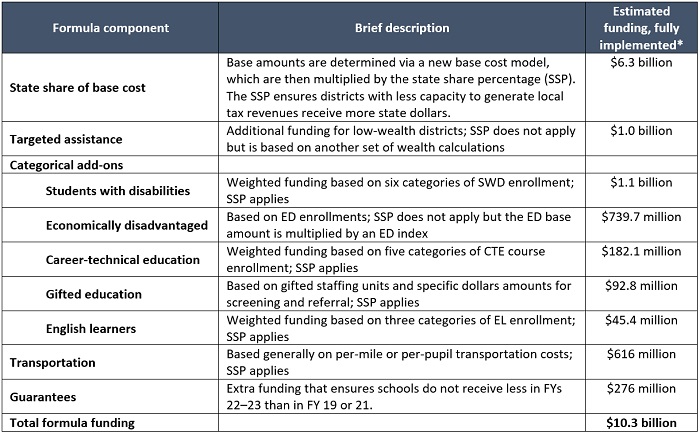
Before turning to predictions, we should first familiarize ourselves with the framework—and see how it differs from prior efforts. Table 1 begins by offering a high-level look at the components of the new formula. The estimated funding levels are included to illustrate the relative size of the components, but due to the phase-in of the new model, these are not the actual amounts that will flow in FYs 2022–23. The table displays the elements that apply to school districts. Charter and STEM schools are eligible to receive all the components with the exception of targeted assistance, gifted, and transportation (though they may receive reimbursement from the state if they provide it).

Table 1: An overview of the HB 110 funding formula

Will Ohio new formula stick blog table 1​

​​* These are LSC estimates based on an earlier iteration of the funding plan that is largely similar to the one passed in HB 110 (more recent estimates aren’t available). These amounts assume a fully implemented formula, something that will not occur in FYs 2022–23. Due to the increased costs of the new model, legislators chose to phase-in the spending increases (33 percent of the increase by FY 2023).

The overall structure should look familiar to Ohio’s policy wonks. Akin to the previous formula, there is a “core” base funding component, targeted assistance, and various categorical add-ons. But there are significant differences, as well. (Another key change, not discussed below, is to “direct fund” choice programs, a topic previously covered.)

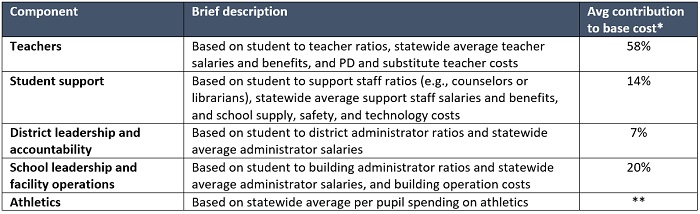
  • Base cost calculations. The core of the new formula is the state share of base cost (SSBC), which replaces the opportunity grant (OG). While the OG simply set a fixed base amount that applied to all districts—most recently $6,020 per pupil—the new model includes detailed “base cost” computations that yield variable base amounts for each district. Those calculations also produce a much higher base, averaging $7,200 per pupil under a fully implemented formula. Table 2 displays an overview of the base cost model for districts. Most of the calculations rely on set staffing ratios that determine the number of employees assumed to be needed in a district. That number is then multiplied by the statewide average salary for a staffing position from FY 2018 to yield an assumed cost of an “input.” A few other calculations—such as technology costs or co-curriculars—rely on a statewide average per-pupil expenditure or a flat amount set in law. Charters and STEMs follow a similar model, but their costs are computed based on statewide district average costs for the support staff, district administration, and school administration and operations components.

Table 2: An overview of the HB 110 base cost model

Will Ohio new formula stick blog table 2​

​​

* These are LSC estimates based on an earlier iteration of the funding plan that is largely similar to the one passed in HB 110. ** In the earlier version of the funding plan, the athletics cost component was part of the student support base-cost component, but in the final legislation, it became a standalone component.

  • New equalizing mechanism. To ensure that lower wealth districts receive more state aid, the SSBC and several other components apply a new “equalizing” mechanism to funding amounts. This lever, known as the state share percentage (SSP), replaces the formerly used state share index (SSI). One of the key differences is that the SSP now incorporates resident income consistently in all districts’ calculations, whereas the SSI only included income under certain conditions. In the new formula, the SSP will be calculated based 40 percent on a district’s resident income and 60 percent on its property values.[1]
     
  • Tweaks in categorical funding. HB 110 maintains longstanding policy by allocating extra dollars to schools serving students with certain characteristics. Yet it makes a few noteworthy revisions. One is a shift away from using straight-up dollar amounts—e.g., adding an extra $1,515 per EL pupil—to multipliers that now fund an EL student at 1.21 times the statewide average base amount. This weighting system ensures that proportional relationships across categories are properly maintained even when the base changes. The new system also alters some of the categorical funding streams. Those include an increase in the economically disadvantaged base from $272 to $422 per pupil, a boost to gifted funding (e.g., raising identification funding from $5 to $24 per pupil), and changes in the definitions of an EL student.

Will this formula stick?

A pessimist’s view first: The most glaring problem is cost. Fully implemented, the new model calls for roughly $2 billion in additional state outlays, an increase of approximately 20 percent over current state expenditures on K–12 education. That amount is driven largely by the sizeable increase to the base amount. Faced with that sticker price, lawmakers chose to pay down just a portion of it over the next two years. Will the next General Assembly be as enthusiastic about this plan and continue its phase-in? Just as daunting is the prospect of millions (billions?) more in additional spending if and when the base cost model is updated with more current salary and expenditure data. Remember, HB 110’s base cost formula relies on FY 2018 staff salaries and benefits. What happens down the road if 2023 or 2025 data are used—especially with the massive federal relief packages making their way to schools? Will future lawmakers go back to the drawing board?

Despite the challenges that lie ahead, there are also good reasons to think the formula will stick. The first is political. The school establishment, which exerts significant influence in the Statehouse, championed this funding model. They aren’t going away and are likely to work to protect the formula and continue pushing for full implementation. Moreover, unlike previous formulas that were closely tied to a sitting governor, this model was developed by legislative leaders—particularly those in the House—which may allow it to better stand the test of time.

A second reason for optimism is that HB 110 makes commendable changes that streamline the system and address structural problems of prior formulas. It now directly funds school choice programs from the state instead of routing those dollars through districts. The new model also makes simplifying changes such as the across-the-board incorporation of districts’ incomes into the SSP, the elimination of funding “caps,” and the removal of a few smallish add-on components.

Color me an optimist, but my view is that the general outline of the HB 110 formula will take hold. And that wouldn’t be such a bad thing. Constantly overhauling formulas creates less fiscal certainty for schools, weakens public confidence in the system, and results in inefficient hold-harmless policies such as “temporary transitional guarantees” that are anything but temporary. That being said, future lawmakers are apt to struggle to fully pay for the model, leading them to either tweak its structure in efforts to control costs or continue underfunding it. In the end, no formula is perfect and funding policy will always be subject to great debate. Nevertheless, this framework might just be the one that lawmakers can work—and live—with for the years ahead.


[1] The SSP can range from 5 to 100 percent. Assuming a base of $7,000 per pupil, a low-wealth district with an SSP of 80 percent would receive $5,600 though the SSBC; a high-wealth district with an SSP of 20 percent would receive $1,400 per pupil. The remainder of the base amount is assumed to be covered by a state-required 2 percent property tax. The SSP does not apply to charter and STEM schools’ funding amounts because they have no local taxing authority.

view

A bright future for open enrollment

Matthew Ladner
8.27.2021
Flypaper

“Hi. Welcome to the future. San Dimas, California. 2688.” Rufus, played by George Carlin, thus opened the American film classic Bill and Ted’s Excellent Adventure by explaining that, in the distant future, everything is great. The water, air, and even the dirt is clean. Bowling averages are up, Rufus explained, and miniature golf scores are way down. I have a report from your state’s much more immediate future that also ultimately constitutes good news. Over a decade ago, the Great Recession kicked off a chain of events that caused Arizona school districts, even the suburban ones, to get very active in open enrollment, accepting students from other communities.

Get ready. A similar dynamic could soon unfold in your state.

Arizona is the demographic canary in America’s coal mine. As both a retirement destination and a border state, Arizona reached your state’s age (older) and demographic future (more Hispanic) faster than you did. But you’ll soon be here. Daily between now and 2030, an average of 10,000 baby boomers will reach the age of sixty-five nationwide, making your state a bit more like Arizona. America’s Hispanic population continues to grow around the country, which is also moving the country in Arizona’s demographic direction.

Arizona experienced rapid population growth for decades after World War II. In the 1990s, the state passed a robust charter school law and required school districts to have open enrollment policies. Suddenly, in 2008, the nation plunged into a housing-lead recession, and K–12 enrollment growth stalled.

Charter school operators still able to access capital in the financial chaos saw an opportunity to serve more students in the property crash. Real estate will likely never be as inexpensive again. But the number of charter school students essentially doubled, and now Arizona has the highest percentage of charter school students, at almost 22 percent.

In the process, Arizona districts became choice operators themselves. Scottsdale Unified, for example, currently has about a fifth of their students coming into the district through open enrollment. The key to spurring open enrollment wasn’t laws. It was incentives. The bureaucracies needed the money, and as some suburban districts got more active in open enrollment, it created competitive pressure on other districts to do the same.

A majority of Phoenix area students do not attend their zip-code-assigned school. District open enrollment students outnumber charter students almost two to one, despite Arizona having the largest charter school enrollment. Perhaps not coincidentally, during all of this, data collected by Stanford University sociologist Sean F. Reardon showed that Arizona students ranked first in academic gains between 2008 and 2018. They learned more per year of schooling during this period than any other state and had strong growth across multiple subgroups.

So what does this have to do with your state? Events seem to be conspiring to crack open suburban districts for open enrollment broadly. First, there was a national baby bust going on before Covid-19. Worst still, a survey by the Guttmacher Institute found that one-third of American women polled in late April and early May wanted to delay childbearing or have fewer children because of the pandemic. This will pinch enrollment.

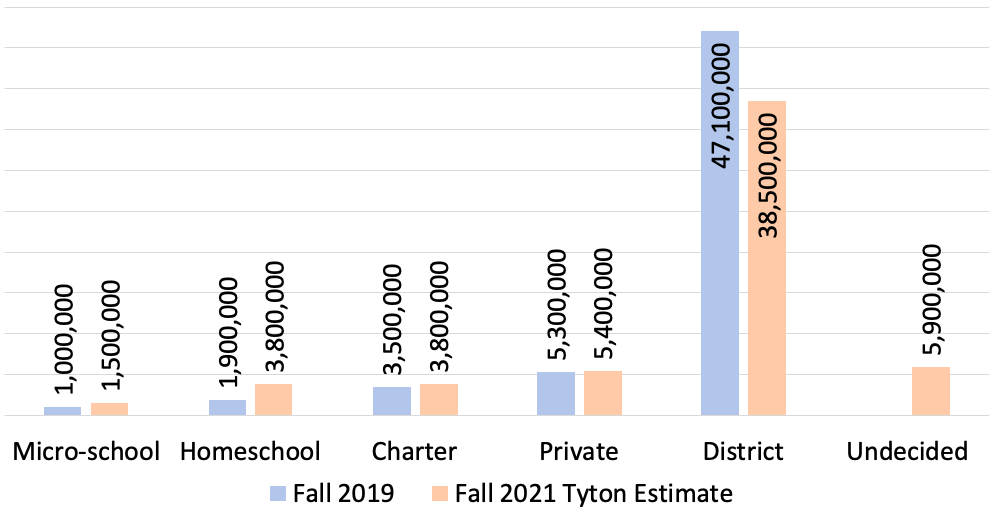
Second, the pandemic has seen a gigantic increase in homeschool enrollment and the creation of an entirely new micro-school sector. Tyton Partners created a panel study of American families to estimate national enrollment trends. Figure 1 below presents its estimates for fall 2021.

Figure 1. U.S. enrollment projections for fall 2019 and fall 2021, by school type.

mlf1

Source: Tyton Partners.

Noteworthy about these estimates: The 1.5 million micro-school students represent the smallest sector, but it took charter schools seventeen years to reach a similar number of students. Almost 6 million students lived in families who were undecided on where their children would attend in the fall 2021. If the undecided in the Tyton estimates choose school sectors similar to those who decided early, it would still result in district enrollment rolling back to 1999 levels. The Census Bureau also reported that 11 percent of students are being homeschooled, while the Tyton estimate showed a smaller increase. One suspects that there is conceptual confusion or overlap between the micro-school and homeschool sectors that we may clarify over time. Whether one or both of these estimates are off, it seems like a good bet that they both represent growing sectors.

The third event that will broaden open enrollment is that a number of states have made very strong improvements to existing choice laws and created new ones.

The upshot of this is that many suburban districts are going to find themselves short of students, which means that many may lower the drawbridge to allow in open enrollment transfers to avoid closure. When this happened in Arizona, the choice knob got turned to “11.” Almost all Arizona districts participate in open enrollment now, even the fancy suburban ones.

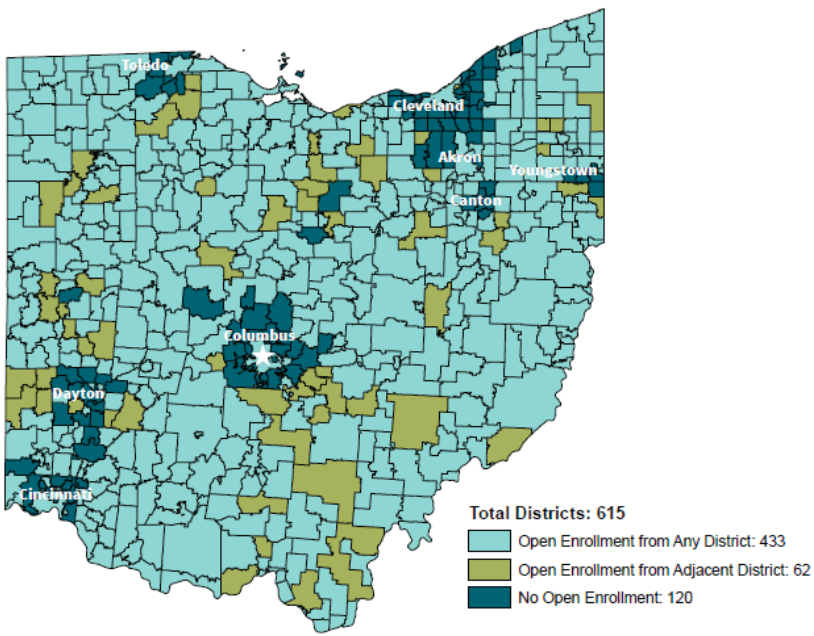
Meanwhile the world as you knew it at the cusp on the pandemic looked more like Ohio than Arizona. In a January report, the Fordham Institute colored every school district in Ohio according to whether they took open enrollment students. In figure 2, notice the almost complete absence of suburban districts taking open enrollment students.

Figure 2. Ohio school districts by open-enrollment status, 2017–18 school year.

mlf2

Much to their credit, Ohio lawmakers have since addressed this situation, removing geographic restrictions on charter schools and creating and strengthening private choice programs. And there’s a push among choice advocates in the state, including from Fordham, to pass legislation creating statewide open enrollment.

A system of school based more on opportunity and less on suburban opportunity hoarding empowers families to decide which schools remain open and which close. It’s also cost-effective, allowing schools to get more learning for each dollar spent. Did I mention that Bill and Ted’s Excellent Adventure was filmed in Phoenix? We’re obviously proud of that too, but you are on your own for improving bowling and miniature golf scores or making the dirt clean.

view

NWEA measures the impact of the pandemic on student achievement and growth

Jessica Poiner
9.2.2021
Flypaper

Researchers at NWEA have been using data from their MAP Growth assessments to predict and analyze learning losses since the start of the pandemic. Their most recent brief examines results from reading and math tests administered to approximately 5.5 million public school students during the fall, winter, and spring of the 2020–21 school year.

To measure the impact of the pandemic on academic progress, NWEA researchers compared 2020–21 results to those from the 2018–19 school year, which they identified as a “typical” year. It’s important to note that, based on prior and additional research conducted by NWEA, there are demographic differences “across subjects and grades in the representation of student groups in fall 2020 compared to fall 2019.” For example, researchers found that students of color were more likely to be missing from data gathered during the pandemic. In addition, the majority of fall 2020 MAP Growth assessments were administered remotely. These and other factors indicate that the impacts of the pandemic on the achievement and growth of various student groups could be underestimated.

Given the myriad disruptions of the pandemic, the results aren’t surprising. In math, students entered the 2020–21 school year behind where they would have started during a normal year. They also exhibited academic gains that were, on average, 8 to 12 percentile points behind the gains made during a typical year. The results were better in reading, but only slightly: Students entered 2020–21 at approximately the same level as usual, but ended the year an average of 3 to 6 percentile points behind.

To measure achievement, NWEA uses 2020 MAP growth norms—a nationally representative set of norms based on testing data from 2015–16 through 2017–18—and compares median end-of-year achievement percentile rankings. These rankings can be used to identify how a student’s score in a particular grade and subject area compares to other same-grade students across the country. When compared to the results of a typical year, student achievement in the spring of 2021 was lower in both math and reading in all grade levels. The size of these declines varied by grade and subject level, but was largest in math. For example, the biggest drop in reading results was in third grade, where scores were 6 percentile points lower in spring 2021 than in the spring of 2019. In math, on the other hand, the largest drops were in third and fifth grade, where scores were 12 points lower.

NWEA found that spring achievement declines between 2019 and 2021 were the largest for minority and economically disadvantaged students. In reading, Black and Hispanic students in grades three through five experienced the greatest drops in achievement. These same students experienced the greatest declines in math, but were joined by students who identified as American Indian and Alaskan Natives. To determine pandemic impacts on students living in poverty, NWEA compared the percentile rankings for high-poverty schools (those where more than 75 percent of students experience poverty) and low-poverty schools (those where less than 25 percent of students experience poverty). In low-poverty schools, the percentile point difference in math between spring 2019 and spring 2021 ranged from 6 points lower in fourth grade to 9 points lower in seventh grade. In high-poverty schools, however, the declines were nearly twice as large. The percentile point difference between 2019 and 2021 ranged from 6 points lower in seventh grade to a whopping 17 points lower in third grade.

NWEA closes their brief by offering six overarching recommendations for how state, district, and local leaders can use achievement and growth data—as well as the unprecedented amounts of federal relief funding that’s available—to reshape education to better serve all students. These recommendations include re-engaging students in school (especially those who have been historically underserved); continuing to support access to remote learning; meeting the physical, social, and mental health needs of students and families; measuring student progress, rethinking assessment systems, and using data to support recovery efforts; supporting and training teachers and leaders; and reimagining accountability and school improvement systems. These are complex recommendations, but NWEA offers plenty of detail about how to implement them effectively. State and local leaders would be wise to consider them. 

SOURCE: “Informing Covid-19 recovery: Insights from NWEA’s MAP Growth assessment and policy recommendations,” NWEA (July 2021).

view

A downbeat assessment of students’ mental and social-emotional health in the Covid era

Jeff Murray
9.2.2021
Flypaper

It is no exaggeration to say that very little good can likely come from a global pandemic, especially in the short term. And while the “term” of the current pandemic seems to lengthen every day, we are still firmly in the realm of the immediate when discussing impacts. Thus the current series of reports coming to us from the Center for Reinventing Public Education (CRPE) under the “Evidence Project” banner are more downbeat table setting than faits accomplis. Their recent gathering of evidence on Covid-19’s effects on the mental health and social-emotional well-being of K–12 students follows that pattern.

The data in this report come from hundreds of studies from across the country—including fact-based accountings of how schools and districts responded to closures, remote learning models, grading, and the like, as well as detailed surveys of students, parents, and teachers. Eight panelists from higher education, non-profits, and student support organizations worked together to analyze and summarize the studies to provide a “coherent baseline” of all that is known and as-yet unknown regarding the state of students’ mindset after more than fifteen months of pandemic disruption to their education.

The summary findings are, as expected, overwhelmingly negative. Between 30 to 40 percent of young people have experienced negative impacts on their mental or social and emotional health during the pandemic, with students who learned remotely for long periods of time, and historically marginalized students, more likely to experience these negative effects. Rates of anxiety and attempted suicides, already on the rise pre-pandemic, appear to have increased among all students, especially girls. Even if some students reported faring well initially—including those who thrived without the distractions and stressors of in-person schooling—those positive effects did not appear to last. Negative effects for students increased over time.

Schools and districts also largely lacked systems to track student well-being and strategies to address and improve it where such effects could be found. This was especially apparent in rural areas without a strong social-service infrastructure outside of the school system. Data on students with disabilities and younger students up to ten years old were lacking, too. As were specifics on which aspects of mental and social-emotional health were the most impacted.

While assuming universally poor outcomes seems prudent at this point in the crisis, it is to be expected that many students will, out of necessity or just out of normal human striving, eventually report a boost in such skills as self-direction and time management. Some teachers reported a concerning lack of student motivation and engagement in learning. But it is also true that there has been no keener test of grit and perseverance in those students’ short lifetimes. Many will ultimately and actively battle their way through the storm.

The CRPE report takes pains to point out all of the information that is still to be collected and assessed, most of it related to specifics of how different types of students responded to education disruption for both better and worse, and what mix of supports and interventions are actually working to help students recover and regain their mental and social-emotional health. In short, we await the less obvious and longer gestating good to balance the immediate and more visible bad.

As stated within, the Evidence Project reports, including this one, are meant to be a first step. All of the data and snapshots will be combined into a “Profile of the American Student” that will “provide a rigorous and nuanced assessment of 1) how extensive student needs and inequities are across a variety of dimensions, 2) how student needs vary across different dimensions and what that implies for policy and practice, and 3) what promising solutions and innovations are emerging to meet students’ needs.” And even that ambitious product will only be a baseline so that future profiles can “track progress toward repaying every student the educational opportunities they are owed after this traumatic and disruptive period.” The downbeat assessment of students’ social and emotional well-being and mental health provided here is, hopefully, the bottom of the ladder.

SOURCE: Laura Hamilton and Betheny Gross, “How Has the Pandemic Affected Students’ Social-Emotional Well-Being? A Review of the Evidence to Date,” Center for Reinventing Public Education (August 2021).

view
OH Gifted Report banner

Do Ohio’s early high achievers stay strong?

9.7.2021
Event

VIRTUAL EVENT - VIA ZOOM

Too often, high-achieving students get lost in the shuffle in debates about improving education for all. Overlooking their talents is troubling. To keep the U.S. and Ohio competitive on a global scale, we need to nurture a next generation of inventors, scientists, and business leaders. Recent debates about race and equity have shown the importance of ensuring that high-achieving children from all backgrounds have ample opportunity to reach the highest rungs of the social ladder.  

The Ohio Association for Gifted Children and the Fordham Institute invite you to an online event to discuss how to improve education for academically talented students. Dr. Scott Imberman of Michigan State University will present findings from a forthcoming Fordham study where he tracks the long-term outcomes of Ohio children who scored in the top 20 percent on third grade state tests. How many early high achievers go on to pass AP tests or ace their college entrance exams? What percentage enroll in four-year colleges? Are there gaps between talented children from less advantaged backgrounds and their peers?

Join us on September 28th to get answers to these questions, and for a lively panel discussion and audience Q&A.

September 28, 2021 at 9:00am ET

Fordham Logo

© 2026 The Thomas B. Fordham Institute
Privacy Policy
Usage Agreement

National

P.O. Box 110
Burke, VA 22009

202.223.5452

[email protected]

Ohio

P.O. Box 82291
Columbus, OH 43202

614.223.1580

[email protected]

Sponsorship

130 West Second Street, Suite 410
Dayton, Ohio 45402

937.227.3368

[email protected]