

Standards & Accountability
Poverty Isn't Destiny
Since 2005, the Thomas B. Fordham Institute has published annual analyses of Ohio’s state report cards.
Since 2005, the Thomas B. Fordham Institute has published annual analyses of Ohio’s state report cards.

Since 2005, the Thomas B. Fordham Institute has published annual analyses of Ohio’s state report cards. Based on data from the 2018-19 school year, this year’s edition contains an explanation of the report card system and an overview of the results, with a special focus on Ohio’s high-poverty urban areas and districts overseen by the state’s Academic Distress Commissions.
The main findings include:
As Ohio continues debate on the design of the state report card and the policies based on it, policymakers should understand the system’s key strengths as well as the results that it yields. We encourage state and local leaders to dive in and take a closer look by downloading Poverty Isn’t Destiny: An analysis of Ohio’s 2018-19 school report cards.
Moving to a new state often means new career opportunities, a better quality of life, or closer proximity to loved ones. But making these transitions comes at a cost, which for some include the need to gain occupational licensing in the new state. To relieve this burden, a group of Ohio legislators recently called for an easing of regulations for people with out-of-state licenses—what’s known as “licensure reciprocity.” The idea is fairly straightforward: When people change states, they don’t suddenly forget how to do their jobs. Hence, workers should be able to simply trade in their licenses without having to go through regulatory hoops all over again.
Using Arizona and Pennsylvania’s recent reforms as a model, legislators seem to be eyeing reciprocity across a variety of professions. While it’s not yet clear whether educator licensure will be included, it should be part of the package. In a Brookings Institution paper, Tom Dee and Dan Goldhaber recommend that states “create meaningful licensure reciprocity” as an effort to address teacher shortages. The National Council on Teacher Quality suggests that states “help make licenses fully portable,” albeit with a debatable proviso that they limit reciprocity to “effective” teachers (how a state would implement this isn’t clear). Finally, speaking to the media outlet The 74, researcher Cory Koedel notes the adverse impacts of licensing requirements in border districts where out-of-state teachers cannot easily fill vacancies despite living just a few miles away.
To be sure, educators coming to Ohio don’t need to start from square one in terms of licensing. For some, it may even be a smooth transition without much red tape. But others face special licensing requirements, even though they may have decades of experience and a stellar teaching record. Let’s take a look at the barriers that out-of-state teachers and principals might face when trying to obtain an Ohio license.
Teachers
Because licensing requirements vary from state to state, most U.S. teachers cannot simply exchange their out-of-state license for a new one. In a 2017 analysis, the Education Commission of the States (ECS) identifies just six states as having “full reciprocity” policies for out-of-state teachers. Ohio is not one of them. Instead, the state adds a few extra requirements before out-of-state teachers can receive an Ohio teaching license. They include the following stipulations:
Principals
Teacher licensing garners the most attention in policy debates, but school leadership positions also require occupational licenses. One such position is the school principal. Ohio does not extend licensure reciprocity to principals: An out-of-state principal—again, no matter their experience or track record as a school leader—must meet the same requirements as an Ohio resident. At first blush, that doesn’t sound unreasonable. However, because principal licensing requirements vary from state to state, it may not be as simple as trading in licenses. Consider some potential complications.
***
Ohio should adopt policies that help to attract great teachers and leaders, no matter where they currently reside. One way to support this goal is to make obtaining an Ohio license as painless as possible for out-of-state educators. Removing licensing requirements that don’t relate to the safety of children, would make the process more seamless and less costly. While some may argue that special Ohio-specific requirements such as extra licensing exams and coursework are necessary quality controls, the evidence that they improve education is weak or lacking. Policymakers should also be mindful that these individuals would possess at least a bachelor’s degree, would have already gone through another state’s licensing process (which require some form of teacher or principal preparation), and must be hired by an Ohio school before they can start work. Full licensing reciprocity for teachers—and all professions in K–12 education—would respect the experience of out-of-state educators, widen the hiring pool for schools needing to fill vacancies, reduce transition costs for people on the move, and make Ohio a more welcoming place for talented individuals to work. What’s not to like?
Editor’s note: It’s been almost ten years since the creation of the Ohio Teacher Evaluation System. This post looks at its genesis, troubled implementation, and recent efforts to replace it with something better.
Back in the late 2000s, Ohio joined dozens of other states in applying in the second round of Race to the Top, a federal grant program that awarded funding based on selection criteria that, among other things, required states to explain how they would improve teacher effectiveness.
Ohio succeeded in securing $400 million. As part of a massive education reform push that was buoyed by these funds, the state created the Ohio Teacher Evaluation System (OTES). It aimed to accomplish two goals: to identify low-performers for accountability purposes, and to help teachers improve their practice.
It’s been nearly a decade, but it’s plenty clear that OTES has failed to deliver on both fronts. The reasons are myriad. The system has been in almost constant flux. Lawmakers started making changes after just one year of implementation. The performance evaluation rubrics and templates for professional growth plans lacked the detail and clarity needed to be helpful. Many principals complained about the administrative burden. Teachers’ experience with the system varied widely depending on the grade and subject they taught. The unfairness of shared attribution and the inconsistency of Student Learning Objectives (SLOs) made the system seem biased. And safe harbor prohibited test scores from being used to calculate teacher ratings, and thus the full OTES framework wasn’t used as intended for three straight school years.
Given all these issues, it should come as no surprise that lawmakers and advocates began working to make serious changes to OTES the moment that ESSA went into effect, given that it removed federal requirements related to teacher evaluations. In the spring of 2017, the Educator Standards Board (ESB) proposed a series of six recommendations for overhauling the system. (You can find in-depth analyses of these recommendations here and here.) These recommendations were then included in Senate Bill 216, the same education deregulation bill that made so many changes to teacher licensure.
When SB 216 went into effect in the fall of 2018, it tasked the State Board of Education with adopting the recommendations put forth by the ESB no later than May 1, 2020. This gap in time provided the state with an opportunity to pilot the new OTES framework in a handful of districts and schools during the 2019–20 school year. The Ohio Department of Education plans to gather feedback from pilot participants, and to refine and revise the framework prior to full statewide implementation in 2020–21.
We’re almost halfway through the 2019–20 school year, which means the OTES pilot—referred to as “OTES 2.0” on the department’s website—is halfway done. We won’t know for sure how implementation of the new framework is going until the department releases its findings and revisions prior to the 2020–21 school year. But OTES 2.0 made some pretty big changes to the way student achievement and growth are measured, and some of those changes are now in place and worth examining.
Prior to the passage of SB 216, Ohio districts could choose between implementing the original teacher evaluation framework or an alternative. Both frameworks assigned a summative rating based on weighted measures. One of these measures was student academic growth, which was calculated using one of three data sources: value-added data based on state tests, which were used for math and reading teachers in grades four through eight; approved vendor assessments used for grade levels and subjects for which value added cannot be used; or local measures reserved for subjects that are not measured by traditional assessments, such as art or music. Local measures included shared attribution and SLOs.
The ESB recommendations changed all of this. The two frameworks and their weighting percentages will cease to exist. Instead, student growth measures will be embedded into a revised observational rubric. Teachers will earn a summative rating based solely on two formal observations. The new system requires at least two measures of high-quality student data to be used to provide evidence of student growth and achievement on specific indicators of the rubric.
A quick look at the department’s OTES 2.0 page indicates that the new rubric hasn’t been published yet. One would hope that’s because the department is revising it based on feedback from pilot participants. Once the rubric is released, it will be important to closely evaluate its rigor and compare it to national models.
The types of high-quality data that are permissible have, however, been identified. If value-added data are available, then it must be one of the two sources used in the evaluation. There are two additional options: approved vendor assessments and district-determined instruments. Approved assessments are provided by national testing vendors and permitted for use by Ohio schools and districts. As of publication, the most recently updated list is here and includes assessments from NWEA, ACT, and College Board. District-determined instruments are identified by district and school leadership rather than the state. Shared attribution and SLOs are no longer permitted, but pretty much anything else can be used if it meets the following criteria:
All of these criteria are appropriate. But they’re also extremely vague. How can a district prove that an instrument is inoffensive? What, exactly, qualifies as a “trustworthy” result? And given how many curricular materials claim to be standards-based but aren’t, how can districts be sure that their determined instruments are actually aligned to state standards?
It’s also worth noting that the department requires a district’s chosen instrument to have been “rigorously reviewed by experts in the field of education, as locally determined.” This language isn’t super clear, but it seems to indicate that local districts will have the freedom to determine which experts they heed. Given how much is on the plate of district officials—and all the previous complaints about OTES being an “administrative burden”—weeding through expert opinions seems like a lot to ask.
The upshot is that Ohio districts and schools are about to have a whole lot more control over how their teachers are evaluated. And it’s not just in the realm of student growth measures either. ODE has an entire document posted on its website that lists all the local decision points for districts.
The big question is whether all this local control will result in stronger accountability and better professional development for teachers. Remember, there’s a reason Race to the Top incentivized adopting rigorous, state-driven teacher evaluation systems: the local systems that were in place previously just weren’t cutting it. Despite poor student outcomes and large achievement gaps, the vast majority of teachers were rated as effective.
Of course, that’s not to say that state models are unquestionably better. OTES had a ton of issues, and the student growth measures in particular were unfair to a large swath of teachers. But still, moving in the direction of considerable local control, regardless of whether it’s the wise thing to do, is risking going back to the days when teacher evaluations were either non-existent or a joke. Teacher quality isn't the only factor affecting student achievement, but it is the most significant one under the control of schools. Here’s hoping that districts take their new evaluation responsibilities very, very seriously.

Titles and descriptions matter in school rating systems. One remembers with chagrin Ohio’s former “Continuous Improvement” rating that schools could receive even though their performance fell relative to the prior year. Mercifully, the state retired that rating (along with other descriptive labels) and has since moved to a more intuitive A–F system. Despite the shift to clearer ratings, the name of one of Ohio’s report card components remains a head-scratcher. As a study committee reviews report cards, it should reconsider the name of the “Gap Closing” component.
First appearing in 2012–13, Gap Closing looks at performance across ten subgroups specified in both federal and state law: All students, students with disabilities, English language learners, economically disadvantaged students, and six racial and ethnic groups. The calculations are based on subgroups’ performance index and value-added scores, along with graduation rates. These subgroup data serve the important purpose of shining a light on students who may be more likely to slip through the cracks.
However, the Gap Closing title suffers from two major problems. First, it implies that schools are being rated based solely on the performance of low-achieving subgroups that need to catch up. But that’s not true. A few generally high-achieving subgroups are also included in the calculations—Asian and white students, most notably. Second, given the component’s name, one would expect to see achievement gap reductions among districts receiving top marks and the reverse among those with widening gaps. Yet as we’ll see, that is not necessarily the case.
To illustrate the latter point in more detail, let’s examine whether gaps (relative to the state average) among economically disadvantaged (ED) and black students are closing by districts’ Gap Closing rating. These subgroups are selected because gaps by income and race are prominent in the education debates, and are likely what comes to mind when people see the term Gap Closing. Of course, this isn’t a comprehensive analysis. Districts struggling to close one of these gaps may have more success with other subgroups. Nevertheless, it’s still a reasonable test to see whether the component is doing as advertised.
There are multiple ways to measure an “achievement gap.” For simplicity, I choose to examine subgroup gaps compared to the statewide average of all students. Table 1 illustrates the method, using the ELA performance index (PI) scores—a composite measure of achievement—for ED students attending the Columbus school district. In this case, the district is narrowing the achievement gap: It had a 21.2 point gap in 2018–19 versus a 23.2 point gap in the previous year.[1]
Table 1: Illustration of an achievement-gap closing calculation

So are highly rated districts on Gap Closing actually narrowing their achievement gaps? And do poorly rated districts see wider gaps over time? The answer is “sometimes, but not always.” Consider the ED subgroup data shown in Table 2. Seventy-eight districts received A’s and B’s for Gap Closing even though their ED subgroup gaps widened in both math and ELA from 2017–18 to 2018–19. On the opposite end, we see that five districts received D’s and F’s despite narrowing gaps for their ED students. The “mixed results” column shows districts that had a narrower gap in one subject but wider gaps in the other.
Table 2: Results for the ED subgroup
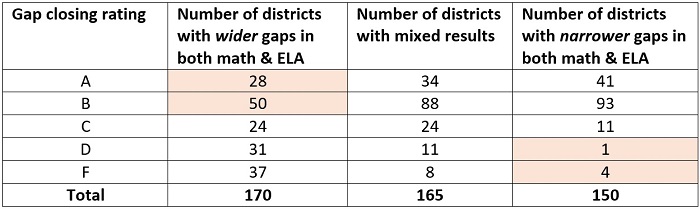
* 123 districts were excluded because they either enrolled too few ED students, or their ED subgroup score was higher than the state average in both 2017–18 and 2018–19 (i.e., there was no gap to evaluate in both years).
Table 3 displays the results for the black subgroup. Again, we see cases in which the Gap Closing rating does not correspond to achievement gap data. Despite a widening gap for black students in both subjects, twenty-seven districts received A’s or B’s on this component. Conversely, five districts received D’s and F’s even though their gap narrowed compared to the prior year.
Table 3: Results for the black subgroup
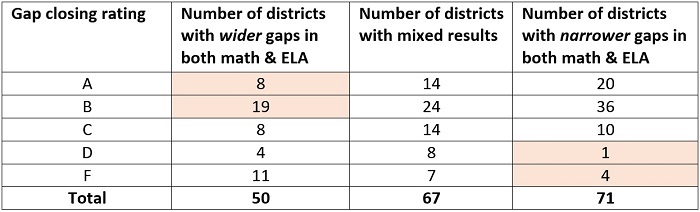
* 420 districts were excluded because they either enrolled too few black students, or their black subgroup score was higher than the state average in both 2017–18 and 2018–19 (i.e., there was no gap to evaluate in both years).
* * *
These results should give us pause about whether Gap Closing is the right name. To address the disconnect, Ohio has three main options, two of which are ill-advised (option 1 and 2 below). The third option—simply changing the name—is the one that state policymakers should adopt.
Option 1: Punt. Policymakers could eliminate the component. But this would remove a critical accountability mechanism that encourages schools to pay attention to students who most need the extra help. It might also put Ohio out of compliance with federal education law on subgroups.
Option 2: Change the calculations. The disconnect in some districts’ results may reflect the reality that Gap Closing does not directly measure achievement gap closing or widening. Ohio could tie the calculations more closely to the name, but there are significant downsides to this alternative.
Option 3: Change the name. Instead of trying to untangle the complications of measuring gap closing, a more straightforward approach is to change the name of the component. We at Fordham have suggested the term “Equity,” which would better convey its purpose and design. The component’s performance index dimension encourages schools to help all subgroups meet steadily increasing state achievement goals. And though not discussed above, the value-added aspect looks at whether students across all subgroups make solid academic growth. In general, these calculations reflect whether students from all backgrounds are being equally well-served by their schools. An “A” on Equity would let the public know that a district’s subgroups are meeting state academic goals, while an “F” would be a red flag that most or all of its subgroups are struggling academically.
Closing achievement gaps remains a central goal of education reform. Yet the Gap Closing language doesn’t quite work when it comes to a report card component name. To avoid misinterpretation, Ohio should change the terminology used to describe subgroup performance.
In our 2019 annual report, we provide insight into our sponsorship work during the year and the performance of our sponsored schools. We are also pleased to highlight the good work of our colleagues on Fordham’s policy and research teams.
Our schools' academic performance shows several schools doing very well on Ohio's value added (growth) measure this year, although other schools struggled. We are excited to continue to grow our portfolio and in turn serve more Ohio students; approximately 5,500 in 2018-19.
The report also draws attention to the hard work and dedication of the boards, leadership and staff at each of our sponsored schools. We are glad that we have the opportunity to support all of them.