Mobile Navigation

  • National
    • Policy
      • High Expectations
      • Quality Choices
      • Personalized Pathways
    • Research
    • Commentary
      • Gadfly Newsletter
      • Flypaper Blog
    • Events
    • Scholars Program
  • Ohio
    • Policy
      • Priorities
      • Media & Testimony
    • Research
    • Commentary
      • Ohio Education Gadfly Biweekly
      • Ohio Gadfly Daily
  • Charter Authorizing
    • Application
    • Sponsored Schools
    • Resources
  • About
    • Mission
    • Board
    • Staff
    • Career
Home
Home
Advancing Educational Excellence

Main Navigation

  • National
  • Ohio
  • Charter Authorizing
  • About

Ohio Menu

  • Topics
    • Accountability & Testing
    • Advanced Education
    • Career & Technical Education
    • Charter Schools
    • Curriculum & Instruction
    • ESSA
    • Evidence-Based Learning
    • Governance
    • Personalized Learning
    • Private School Choice
    • School Finance
    • Standards
    • Teachers & School Leaders
  • Research
  • Policy
  • Commentary
    • Ohio Gadfly Newsletter
    • Ohio Gadfly Blog
    • Events

The Education Gadfly Weekly

Sign Up to Receive Fordham Updates

We'll send you quality research, commentary, analysis, and news on the education issues you care about.
Thank you for signing up!
Please check your email to confirm the subscription.

Ohio Education Gadfly Biweekly--Volume 12, Number 22

Volume 12, Number 22
11.5.2018
11.5.2018

Ohio Education Gadfly Biweekly--Volume 12, Number 22

Volume 12, Number 22
view
Standards & Accountability

“Fixing” Ohio’s graduation rate should be the least of our concerns

Ohio’s news outlets have covered the debate over graduation requirements as if it were a burning problem that policymakers need to urgently “fix.” For instance, the local NPR affiliate headlined an article, “Ohio education panel still crafting long-term fix on graduation stan

Aaron Churchill 11.5.2018
OhioOhio Gadfly Daily

“Fixing” Ohio’s graduation rate should be the least of our concerns

Aaron Churchill
11.5.2018
Ohio Gadfly Daily

Checking up on chronic absenteeism in the Buckeye State

Jessica Poiner
11.2.2018
Ohio Gadfly Daily

Ohio’s average ACT score dropped, but that’s not a bad thing

Jessica Poiner
11.5.2018
Ohio Gadfly Daily

Grade inflation will catch up with Ohio students

Michael J. Petrilli
10.30.2018
Ohio Gadfly Daily

You're invited - Ohio in a Post-Janus World

Ohio Education Gadfly
11.5.2018
Ohio Gadfly Daily

Tackling Ohio’s toughest education challenges: Provide tax benefits to employers that train apprentices

Ohio Education Gadfly
10.29.2018
Ohio Gadfly Daily

Tackling Ohio’s toughest education challenges: Create an incentive program to attract and develop high-performing teachers

Ohio Education Gadfly
11.5.2018
Ohio Gadfly Daily
view

Checking up on chronic absenteeism in the Buckeye State

Jessica Poiner 11.2.2018
Ohio Gadfly Daily
view

Ohio’s average ACT score dropped, but that’s not a bad thing

Jessica Poiner 11.5.2018
Ohio Gadfly Daily
view

Grade inflation will catch up with Ohio students

Michael J. Petrilli 10.30.2018
Ohio Gadfly Daily
view

You're invited - Ohio in a Post-Janus World

Ohio Education Gadfly 11.5.2018
Ohio Gadfly Daily
view

Tackling Ohio’s toughest education challenges: Provide tax benefits to employers that train apprentices

Ohio Education Gadfly 10.29.2018
Ohio Gadfly Daily
view

Tackling Ohio’s toughest education challenges: Create an incentive program to attract and develop high-performing teachers

Ohio Education Gadfly 11.5.2018
Ohio Gadfly Daily
view

“Fixing” Ohio’s graduation rate should be the least of our concerns

Aaron Churchill
11.5.2018
Ohio Gadfly Daily

Ohio’s news outlets have covered the debate over graduation requirements as if it were a burning problem that policymakers need to urgently “fix.” For instance, the local NPR affiliate headlined an article, “Ohio education panel still crafting long-term fix on graduation standards.” The Dayton Daily News ran a piece titled, “State school board backs long-term graduation changes, weighs emergency fix.”

Such headlines are likely inspired by public officials who have raised alarms over the past two years that Ohio’s new graduation standards would withhold diplomas from too many students. In fact, one former State Board of Education member predicted that graduation rates would fall sharply to 60 percent for the class of 2018, the first cohort subject to the state’s updated requirements that include exam-based and career-technical pathways. Based on these concerns, state lawmakers approved softball alternatives that this cohort could meet to receive high school diplomas. Various policymakers have expressed interest in extending less demanding options to future graduating classes.

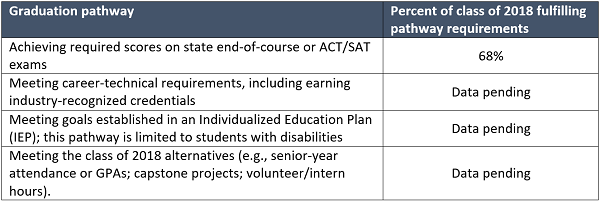
Now that much of the class of 2018 has moved onto bigger and better things, it’s a good time to step back and see how these students fared in terms of meeting graduation standards. Should there be continuing concern over the possibility of dramatically lower rates? At the October state board meeting, the Ohio Department of Education released the following data:

Fixing grad rates Chart 1

The first thing to know about these data is that this calculation includes the entire class of 2018—not just students enrolled in their senior year—and thus includes students who have dropped out. This is important because we can compare, roughly, the graduation rate for the class of 2018 to previous years, which include dropouts, to see if rates would’ve plummeted to unprecedented levels had there been no alternatives.

Now to the data: We observe that 68 percent of the class of 2018 met the exam-based requirements. Right off the bat we can rule out concerns that graduation rates would’ve fallen to 60 percent. ODE does not yet have data on students meeting the career-technical requirements—a rigorous pathway that requires young people to earn industry credentials. In recent years, 4 percent of Ohio’s graduates earned such credentials, but that number may rise now that it’s included as a pathway. Let’s add a few percentage points to the 68 percent rate—perhaps 4 to 7—to account for these graduates. We also see that some special-education students may earn diplomas via their IEP goals. While this number may fall under new federal guidelines, roughly 5 percent of the class of 2017 earned diplomas through this pathway. [1] Using these three existing means for earning a diploma, it’s likely Ohio would have registered a graduation rate of about 77 to 80 percent. That’s without any alternatives pathways. As for the alternatives, odds are that at least a small percentage of these students would have earned a diploma through the original pathways without the additional options being available.

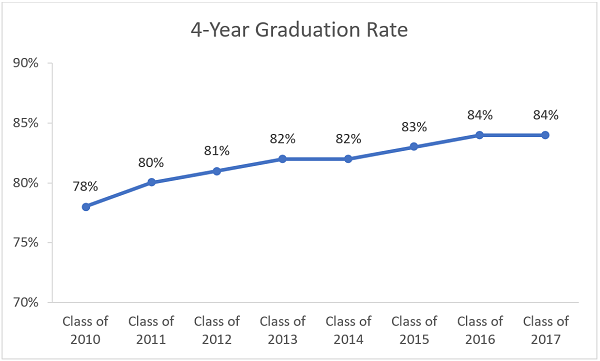
A graduation rate in this range would be somewhat lower than in the most recent years. However, rates in the mid- to high-70s are not exceptionally low, as the chart below indicates. Bear in mind that these rates reflect students who graduated under the eighth-grade level Ohio Graduation Tests (OGTs), while current students have to meet more demanding requirements. Thanks to the hard work of the class of 2018 and Ohio’s educators, this was the “apocalypse”—as one superintendent predicted—that never came to pass.

Figure 1: Ohio graduation rates, classes of 2010 through 2017

Fixing grad rates Chart 2

The more important question—then, just as now—is how to better support the 15 to 25 percent of students who are on the shakiest paths to post-secondary success as adults. In this regard, Ohio does face a problem that demands solutions. The answer, however, isn’t to find ways to shamelessly manufacture, diploma-mill-style, credentials backed by no objective demonstration of the academic or technical competencies needed for college, career, and military service. Softened standards permit young people to enter the “real world” ill-equipped to meet the more rugged demands of colleges and employers. They also discourage young men and women from accumulating valuable skills and abilities. This is the opportunity cost of less rigorous pathways. How many students in the class of 2018 stopped working hard to meet academic or technical goals when the easier routes were introduced?

The answer, rather, is to recommit to efforts that strengthen the readiness of young people for life after high school. This means focusing on teaching math, English, science, and social studies—the four core subjects critical to success in life—so that more students can breeze through their end-of-course exams. It also means opening more quality career-and-technical opportunities, including access to industry-credentialing programs and business-based apprenticeships. It means encouraging students, as they enter high school, to set ambitious goals—and cheering them on as they work hard to meet them—and it could mean, at times, delivering tough news about the work ahead. It might also require ramping up fifth-year high school programs, or improving adult education that supports GED acquisition. Contrary to what some seem to believe, life isn’t over if you don’t complete a high school education in four years. Of course, it also means starting early by teaching reading properly in elementary schools and ensuring that youngsters gain a rich knowledge base, so that they’re well prepared for high-school-level work.

Let’s stick a fork in the argument that Ohio’s graduation rate would fall through the floor under the new requirements. The data just don’t support that story. Instead, policymakers would better serve Ohio’s young men and women by focusing on ways to improve academic achievement and technical-skills acquisition for all. Former State Board president Tom Gunlock got to the heart of the matter when he wrote on these pages:

Yes, it [helping all students meet high graduation standards] will be hard work. Yes, it will push all of us outside our comfort zones. We know that the conditions aren’t always ideal for change to occur. We’ll find strength in working together and supporting each other, and knowing that the work we do will create hope—hope for our students, hope for our communities, and hope for the future of our state. Let’s commit ourselves once again—educators, state government, communities, and partners of all varieties—to do what we know can be done. Our children and future generations will thank us.

Well said.


[1] Moving forward, it’s unclear how Ohio will report students earning diplomas through their IEP. For the purposes of comparing class of 2018 data to prior years, this analysis assumes that they are counted in the 2018 graduation rate, since this was done in prior years.


view

Checking up on chronic absenteeism in the Buckeye State

Jessica Poiner
11.2.2018
Ohio Gadfly Daily

It’s no secret that school attendance is a significant factor in student achievement. In elementary school, truancy can contribute to weaker math and reading skills that persist into later grades. Students who are chronically absent often experience future problems with employment, including lower-status occupations, less stable career patterns, higher unemployment rates, and low earnings.

That’s why Ohio has spent the past few years overhauling its student attendance and absenteeism policies. It started back in December of 2015, with the introduction of House Bill 410, whose major provisions prohibited districts from including truancy in their zero tolerance discipline policies and required them to assign truant students to an absence intervention team that would create a personalized intervention plan. These changes were made because schools often dealt with absenteeism by suspending truant students instead of helping them. This punitive system forced students to miss even more school and exacerbated negative impacts. The bill also changed the state’s definition of chronic absenteeism to be based on hours instead of days, a shift that aligned attendance policies with the state’s instruction requirements that were changed from days to hours during the 2014–15 school year.  

Meanwhile, in 2017, the Ohio Department of Education released the state’s ESSA plan. ESSA, the federal education law that succeeded the No Child Left Behind Act, requires states to include in their accountability systems at least one additional measure of school quality or student success. Ohio, like a majority of states, opted to use chronic absenteeism as its additional measure. The indicator is based on the percentage of students who are chronically absent, which is defined as missing at least 10 percent of instructional time for any reason, including both excused and unexcused absences. Based on the state’s required minimum of instructional hours, that equates to ninety-one hours per year for students in grades K–6 and one hundred hours per year for students in grades seven through twelve.

Ohio has reported chronic absenteeism data on school and district report cards since the 2014–15 school year. Prior to HB 410 going into effect, districts and schools labeled students as habitually truant if they were absent without legitimate excuse for twelve or more days in a school year and chronically truant if they were absent without legitimate excuse for fifteen or more days. Although the 2017–18 school year shifted the calculation to hours and narrowed state law to one definition of truancy, the hourly threshold adds up to about the same number of days identified under previous law for chronic truants: For students in grades K–6, ninety-one hours per year is equivalent to about fourteen days, and for students in grades seven through twelve, one hundred hours per year equals around fifteen days.

Although these thresholds appear similar at first glance, they yield very different results when implemented. For instance, under a policy that measures days, a student could arrive an hour late or leave an hour early and still be considered “present” for the day. Under a policy that measures hours, however, the student would be counted as absent for both hours. In addition, both Ohio’s ESSA plan and report card guidance indicate that chronic absenteeism is determined based on unexcused and excused absences, while previous law only considered students who were absent without legitimate excuse. Given these nuances, one would expect to see a larger number of districts with high chronic absenteeism rates during 2017–18 than in years past.

And indeed, that’s exactly what the data show. Based on current and previous years’ report card data from ODE, thirty districts had chronic absenteeism rates of 20 percent or higher during the 2014–15 school year. That number rose to thirty-two during the 2015–16 school year, and in 2016–17 it increased again to forty-nine. By 2017–18, the number of districts with chronic absenteeism rates of 20 percent or higher had risen to seventy-five.

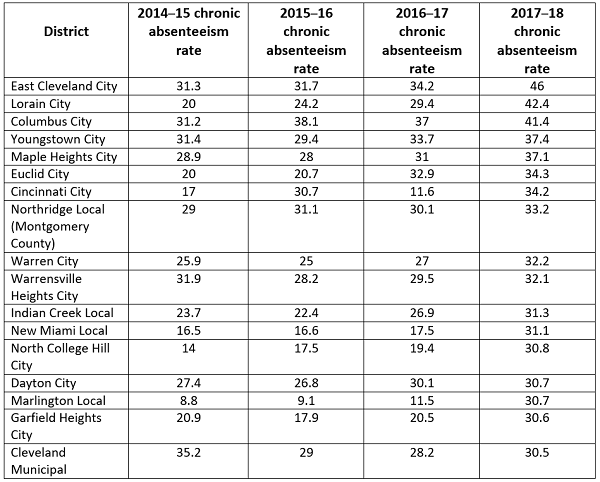
In most cases, though, districts that posted high chronic absenteeism rates in 2017–18 have a history of high or steadily increasing rates. The table below lists the districts with chronic absenteeism rates of 30 percent or higher during the 2017–18 school year and includes their rates from each of the previous school years when absenteeism was measured by days instead of hours.

absenteeism chart

Sixteen of the seventeen districts included in the table above had higher chronic absenteeism rates in 2017–18 than they did in 2014–15. The only exception was Cleveland Municipal, whose rate decreased by nearly 5 percentage points. Some districts, like Northridge Local, Warrensville Heights, and Dayton City, saw their rates only increase by a few percentage points. But other districts saw significant surges. Lorain City, for example, went from 20 percent in 2014–15 to 42 percent in 2017–18. Marlington Local, meanwhile, went from hovering right around 10 percent for three years to an eye-popping 30 percent. It’s likely that these sudden and significant increases are due to the new definition of chronic absenteeism, but large variations from year to year—like those reported by Cincinnati City—could also indicate difficulties with data reporting. 

Even allowing for the impact of a new definition of chronic absenteeism, the data outlined here are disheartening. There is good news, however. First, policymakers should be applauded for changing state law to measure absenteeism based on hours rather than days. This change should yield much more accurate measurements of how much school students are missing. Second, although requiring schools to create intervention teams and personalized plans for students (as HB 410 does) is a lot of work, it is also a solid foundation for improvement. Districts and schools with the highest chronic absenteeism rates would be wise to take implementation seriously. Finally, including chronic absenteeism as a small portion of report cards ensures that districts and schools have a consistent incentive to improve their rates without taking away from important measurements of academic growth and achievement. Ohio may have some disheartening data, but it also has some solid policies in place—and that’s a good place to start.

view

Ohio’s average ACT score dropped, but that’s not a bad thing

Jessica Poiner
11.5.2018
Ohio Gadfly Daily

A few weeks ago, officials at ACT released a report that breaks down the ACT test results of the 2018 graduating class. It examines participation and performance overall, as well as data based on college and career readiness benchmarks in English, reading, math, and science that indicate whether students are prepared to succeed in first-year college courses. 

At the national level, the results are disheartening. The data—which account for more than 1.9 million graduates, or 55 percent of students in the 2018 national graduating class—show that the average composite score dropped from 21 to 20.8. Average scores in all four subjects also slid compared to last year (though only between 0.1 and 0.3 points).

As for the benchmarks, readiness in both math and English has been steadily declining since 2014. This year was no exception: 40 percent of graduates met the math benchmark, the lowest percentage in fourteen years, and 60 percent met the benchmark in English, the lowest level since the benchmarks were first introduced. Reading and science readiness levels were both down by 1 percentage point compared to the year prior, but generally show flat long-term trends.

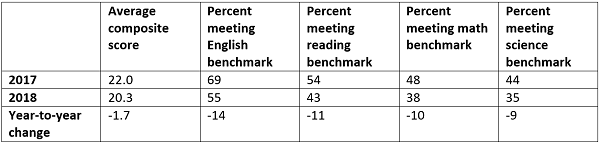
In Ohio, the declines were larger. The table below indicates that Ohio’s average composite score and the percentage of students meeting readiness benchmarks in all four subjects declined significantly compared to last year.  

ACT score chart 1

It’s understandable that folks might see these sharp declines and start to worry. But in Ohio, the changes can be attributed largely to the increasing number of students taking the test. Among the class of 2017, ACT estimates that 75 percent took the test. But thanks to a change in state policy that required all juniors to take either the ACT or the SAT, this year’s percentage was much higher. Data provided by ACT estimate that 100 percent of the class of 2018 took the test at some point between grades 10 and 12.[1] With such a significant increase in the number of students taking the test—including academically struggling students who may not have taken it otherwise—it’s understandable that Ohio’s performance would drop.

In a previous piece, I explained why statewide administration is good policy even though it may lead to overall declines. Those reasons are worth revisiting now:

Opening doors to postsecondary options. According to ACT, many students who were not considering college have gone on to attend after earning an encouraging score as part of a statewide administration. Many of these students were from traditionally underrepresented groups—minority and low-income students. Data out of Kentucky corroborate ACT’s findings and show that college-going rates have improved since it became state law in 2008 to administer the ACT. Illinois has also experienced a similar increase in overall college enrollment after it began statewide administration.    

Providing useful and easily comparable information. ACT offers national and state-specific annual reports about results. In the past, these resources had limited usefulness because they included only students who chose to take the assessments. Now that all students are participating, the results could help identify achievement gaps, offer more details about progress (or lack thereof) over time, and serve as a comparison point for Ohio’s end-of-course exams and national exams like NAEP. Schools could also use these data to intervene with students in need of remediation before they graduate—which could save students and families both time and money.

Improving alignment to the state accountability system. Although the ACT isn’t included as part of the state’s proficiency and growth components, there is a state report card indicator that takes it into account: the Prepared for Success component. For this component, districts are graded on an A–F scale based on a point system comprised of a variety of measures, including points for each student who earns a remediation-free score on either the ACT or SAT. Previously, only students who chose to take these tests were accounted for; with full participation, we’ll now get a more complete view of how many students are being prepared for post-secondary education. 

***

The decline in Ohio’s composite score and readiness benchmark percentages should be a sobering reminder for Ohioans that there is still plenty of work to be done. But it should not cause panic: The decrease coincides with a significant increase in test-takers, and the results are a far more wide-ranging picture of students’ achievement. Statewide administration ensures that all students have the opportunity to take the exam at least once, including traditionally underrepresented groups and those that may doubt their potential—and that’s good policy.


[1] The methodology for how ACT calculated 100 percent participation is not totally clear, but with the new state law in place it is certain that the percentage of test-takers increased significantly.

view

Grade inflation will catch up with Ohio students

Michael J. Petrilli
10.30.2018
Ohio Gadfly Daily

Although 90 percent of American parents believe their children are performing at or above grade level; in reality two-thirds of U.S. teenagers are ill-prepared for college when they leave high school. A major reason for this enormous disconnect is grade inflation.

According to a recent study conducted by American University professor Seth Gershenson and published by the Thomas B. Fordham Institute, grade inflation is for real — and widespread. Analyzing statewide end-of-course exams in algebra from North Carolina, Gershenson found that between 2005 and 2016 many students who received As and Bs from their teachers struggled on the state tests.

This matters immensely, since he also found those exams to be far better predictors of students’ ACT scores and thus their academic preparedness for college.

Further, over the years that he studied, grade inflation occurred in both high- and low-income schools. Like the Tar Heel State, Ohio uses high school end-of-course exams. Last year, just 61 percent of students were proficient on the algebra assessment. Given that algebra is required to receive a diploma, it appears that a large fraction of young Ohioans are passing the course even though they can’t demonstrate proficiency on an objective assessment of algebra knowledge.

This disconnect between course grades and test performance spurred Ohio educators to warn in 2016 that hordes of students would never meet the state’s new and tougher high school graduation requirements, as those are based upon end-of-course exams in math and three other subjects. Fears of low passage rates and, thus, lower graduation rates, led Buckeye lawmakers to approve a temporary — and very weak — set of “alternative pathways” for the class of 2018, which was the first to be affected by the rigorous new requirements. Instead of ever demonstrating competency on an objective measure of skills and knowledge, members of that class could get diplomas via a grab bag of dubious accomplishments like good attendance, a part-time job and senior-year course grades.

Gershenson’s findings should worry Ohio policymakers: If grade inflation makes it easier to pass courses without actually learning the content, then the state risks signaling to parents that their children are ready for college or career when in reality they’re not. This will lead to higher graduation rates, which feel good and make for great headlines, but harm the young men and women who are thrust into the adult world with a false sense of preparedness.

The point isn’t that one should trust tests and mistrust teacher grades. Both have value. High school GPAs, for example, are highly correlated with later academic outcomes. And both measures provide important information because they measure different aspects of student performance and potential.

Going forward, the Ohio State Board of Education has — foolishly, in my view — asked the legislature to extend the easy diploma pathways, and some leaders are unwilling to believe that upcoming classes can meet high expectations. Parents, educators and citizens should push back.

A primary purpose of high school is to prepare students for adulthood and the professional world. A diploma is meant to certify that a student is ready for these challenges. But they can’t do this if diplomas get easier to earn. State exams serve as an important check on course grades.

So let’s please not settle for graduation requirements that rely too much on inflated grades. And let’s keep Ohio’s end-of-course exams, which hold our students to high expectations and help parents know whether the As and Bs they see on their kids’ report cards are consistent with their true level of readiness for what follows.

This piece was first published in the Columbus Dispatch.

view

You're invited - Ohio in a Post-Janus World

Ohio Education Gadfly
11.5.2018
Ohio Gadfly Daily

On June 27, the U.S. Supreme Court voted 5-4 to prohibit public-employee labor unions from collecting “agency” or “fair share” fees, overturning a 41-year-old precedent. At the time, the ruling in the case of Janus v. American Federation of State, County, and Municipal Employees Council 31, was thought to have broad implications for education. What, if anything, has changed in the ensuing months? What will happen further down the line?

We invite you to join us in Columbus on Thursday, November 29 for an important conversation on the implications of Janus in Ohio and how it's likely to impact education.

Doors open at 8:00 am; coffee and pastries will be served.

view

Tackling Ohio’s toughest education challenges: Provide tax benefits to employers that train apprentices

Ohio Education Gadfly
10.29.2018
Ohio Gadfly Daily

Editor’s Note: As Ohioans prepare to elect a new governor this November, and as state leaders look to build upon past education successes, we at the Fordham Institute are developing a set of policy proposals that we believe can lead to increased achievement and greater opportunities for Ohio students. This is the fifth in our series, under the umbrella of ensuring seamless transitions to college or career. You can access all of the entries in the series to date here.


Proposal: Create a tax-credit program that allows employers to reduce their state tax liabilities based on the number of students who complete a state-registered apprenticeship at their worksite.


Background: In contrast to traditional career and technical programs, where training is delivered entirely by K–12 schools, apprenticeships include paid on-the-job training provided by employers or professional associations in addition to formal education. American high school students rarely participate in apprenticeships, though their counterparts in countries like Germany and Switzerland are far more likely to do so. Apprenticeships are slowly gaining traction in other states, including Georgia, Maryland, and Wisconsin, which have devised apprenticeship programs geared toward high school students. In Ohio, students aged sixteen or older can participate in one of the state’s registered apprenticeships (though some programs set eighteen as the minimum age). Although no state data exist on how many high school students participate in apprenticeships—the state should begin tracking this—the number is not likely to be high. One possible barrier is employers’ capacity to provide meaningful training opportunities: though apprenticeships may be a key part of some companies’ HR strategy, others may not see them as a cost-effective way of building their workforce. Employers bear costs that include training and supervision, along with paying wages—all for benefits that may not materialize if apprentices later take positions at another company.


Proposal rationale: Apprenticeships allow students to gain on-the-job training and can improve the fit between employee skills and business needs. However, this training model has long been neglected in the U.S. as a way to build high school students’ work-ready skills. By covering a portion of employers’ apprenticeship costs, a tax-credit program would encourage more Ohio employers to provide on-site training for students seeking apprenticeships.


Cost: This proposal would not require a direct appropriation of state funds; however, it would reduce state revenue. The amount would depend on the nature and value of the tax credit as well as the resulting rate of student completions of apprenticeships. Any credit given should start at a relatively modest amount so that employers still have skin in the game and to ascertain how the market responds.


Resources: For an overview of apprenticeships from an international and economic perspective, see the chapter titled “Apprenticeships” in Handbook of the Economics of Education, Volume 3 (2011), written by Stefan Wolter and Paul Ryan; for discussion on apprenticeships from an employers’ view, see the 2016 report The Benefits and Costs of Apprenticeships: A Business Perspective by Susan Helper, et al., published by Case Western Reserve University/the U.S. Department of Commerce; for more on Wisconsin’s apprenticeship program, see the Wisconsin Department of Education’s “Wisconsin Youth Apprenticeship”; and for a list of registered apprenticeships in Ohio, see the Ohio Department of Job and Family Services’ “Apprenticeship.”

view

Tackling Ohio’s toughest education challenges: Create an incentive program to attract and develop high-performing teachers

Ohio Education Gadfly
11.5.2018
Ohio Gadfly Daily

Editor’s Note: As Ohioans prepare to elect a new governor this November, and as state leaders look to build upon past education successes, we at the Fordham Institute are developing a set of policy proposals that we believe can lead to increased achievement and greater opportunities for Ohio students. This is the seventh in our series, under the umbrella of supporting great educators. You can access all of the entries in the series to date here.


Proposal: Establish a competitive grant program that would provide funds to implement human-capital initiatives aimed at attracting and/or developing classroom talent. These grants could be used to support innovative compensation strategies, such as differential pay structures, signing or performance bonuses, or assistance with paying off student loans. They could also be used to implement mentoring, evaluation, retention, and development programs that ensure great teachers remain in classrooms and take on instructional leadership roles. The grants should be open to districts, charter and STEM schools, as well as to consortia of educational institutions.


Background: Attracting talented individuals to the teaching profession remains key to developing a high-performing K–12 system. But in an increasingly competitive job market, schools have had trouble drawing top talent into their classrooms. A 2010 McKinsey report found that just 23 percent of U.S. teachers came from the top third of their college graduating class, with only 14 percent of new teachers in high-poverty schools coming from that tier. Although we don’t have comparable statistics for Ohio, data and news reports suggest that a great many of the state’s schools struggle to fill teaching positions, especially in hard-to-staff subjects. A recent analysis, for example, indicates an oversupply of recent graduates in early education and ELA, alongside a shortage of those prepared to teach in the STEM fields. Schools in remote rural communities and inner cities also face challenges attracting top-notch talent into their classrooms. Ohio has undertaken efforts to bolster the teacher pipeline, including the introduction of Teach For America, a national nonprofit that recruits high-performing college graduates. But Ohio schools continue to face challenges recruiting and retaining the best and the brightest young people to work in education.


Proposal rationale: Ohio schools compete with other states and professions to draw talented, motivated individuals into their classrooms. A competitive grant program would encourage districts and schools to pursue new ways to do this.


Cost: The state should allocate $30 million to this program over two fiscal years, $10 million for the first year and $20 million for the second year. This relatively modest amount would support schools seeking to experiment or pilot human-capital initiatives, with the aim of full implementation using general operating funds after grants expire. A portion of state funding should be set aside to ensure rigorous evaluation of the grant-funded initiatives.


Resources: For an analysis on the college performance of U.S. teachers, see the 2010 McKinsey and Company report Closing the Talent Gap: Attracting and Retaining Top-Third Graduates to Careers in Teaching by Brian Auguste and colleagues. For data on Ohio’s educator workforce, see the 2013 Ohio Research Center report Teacher Supply and Demand in Ohio by Jay Zagorsky and colleagues. For an overview of strategies for teacher recruitment and retention, see the 2016 Center for American Progress report To Attract Great Teachers, School Districts Must Improve Their Human Capital Systems by Annette Konoske-Graf and colleagues. And for examples of innovative staffing models, see Public Impact’s website “Opportunity Culture.”

Fordham Logo

© 2026 The Thomas B. Fordham Institute
Privacy Policy
Usage Agreement

National

P.O. Box 110
Burke, VA 22009

202.223.5452

[email protected]

Ohio

P.O. Box 82291
Columbus, OH 43202

614.223.1580

[email protected]

Sponsorship

130 West Second Street, Suite 410
Dayton, Ohio 45402

937.227.3368

[email protected]