It’s no secret that school attendance is a significant factor in student achievement. In elementary school, truancy can contribute to weaker math and reading skills that persist into later grades. Students who are chronically absent often experience future problems with employment, including lower-status occupations, less stable career patterns, higher unemployment rates, and low earnings.
That’s why Ohio has spent the past few years overhauling its student attendance and absenteeism policies. It started back in December of 2015, with the introduction of House Bill 410, whose major provisions prohibited districts from including truancy in their zero tolerance discipline policies and required them to assign truant students to an absence intervention team that would create a personalized intervention plan. These changes were made because schools often dealt with absenteeism by suspending truant students instead of helping them. This punitive system forced students to miss even more school and exacerbated negative impacts. The bill also changed the state’s definition of chronic absenteeism to be based on hours instead of days, a shift that aligned attendance policies with the state’s instruction requirements that were changed from days to hours during the 2014–15 school year.
Meanwhile, in 2017, the Ohio Department of Education released the state’s ESSA plan. ESSA, the federal education law that succeeded the No Child Left Behind Act, requires states to include in their accountability systems at least one additional measure of school quality or student success. Ohio, like a majority of states, opted to use chronic absenteeism as its additional measure. The indicator is based on the percentage of students who are chronically absent, which is defined as missing at least 10 percent of instructional time for any reason, including both excused and unexcused absences. Based on the state’s required minimum of instructional hours, that equates to ninety-one hours per year for students in grades K–6 and one hundred hours per year for students in grades seven through twelve.
Ohio has reported chronic absenteeism data on school and district report cards since the 2014–15 school year. Prior to HB 410 going into effect, districts and schools labeled students as habitually truant if they were absent without legitimate excuse for twelve or more days in a school year and chronically truant if they were absent without legitimate excuse for fifteen or more days. Although the 2017–18 school year shifted the calculation to hours and narrowed state law to one definition of truancy, the hourly threshold adds up to about the same number of days identified under previous law for chronic truants: For students in grades K–6, ninety-one hours per year is equivalent to about fourteen days, and for students in grades seven through twelve, one hundred hours per year equals around fifteen days.
Although these thresholds appear similar at first glance, they yield very different results when implemented. For instance, under a policy that measures days, a student could arrive an hour late or leave an hour early and still be considered “present” for the day. Under a policy that measures hours, however, the student would be counted as absent for both hours. In addition, both Ohio’s ESSA plan and report card guidance indicate that chronic absenteeism is determined based on unexcused and excused absences, while previous law only considered students who were absent without legitimate excuse. Given these nuances, one would expect to see a larger number of districts with high chronic absenteeism rates during 2017–18 than in years past.
And indeed, that’s exactly what the data show. Based on current and previous years’ report card data from ODE, thirty districts had chronic absenteeism rates of 20 percent or higher during the 2014–15 school year. That number rose to thirty-two during the 2015–16 school year, and in 2016–17 it increased again to forty-nine. By 2017–18, the number of districts with chronic absenteeism rates of 20 percent or higher had risen to seventy-five.
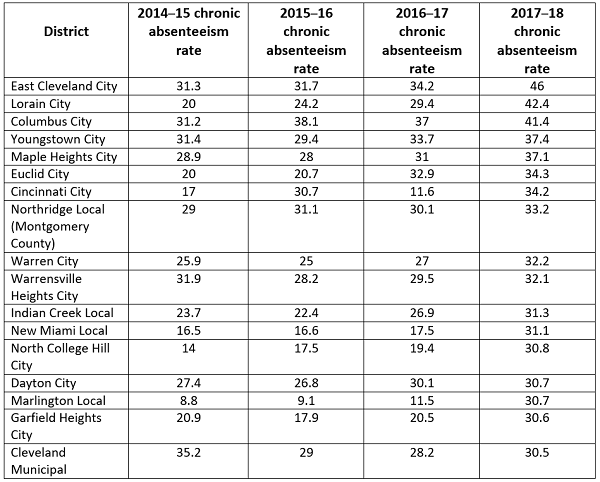
In most cases, though, districts that posted high chronic absenteeism rates in 2017–18 have a history of high or steadily increasing rates. The table below lists the districts with chronic absenteeism rates of 30 percent or higher during the 2017–18 school year and includes their rates from each of the previous school years when absenteeism was measured by days instead of hours.

Even allowing for the impact of a new definition of chronic absenteeism, the data outlined here are disheartening. There is good news, however. First, policymakers should be applauded for changing state law to measure absenteeism based on hours rather than days. This change should yield much more accurate measurements of how much school students are missing. Second, although requiring schools to create intervention teams and personalized plans for students (as HB 410 does) is a lot of work, it is also a solid foundation for improvement. Districts and schools with the highest chronic absenteeism rates would be wise to take implementation seriously. Finally, including chronic absenteeism as a small portion of report cards ensures that districts and schools have a consistent incentive to improve their rates without taking away from important measurements of academic growth and achievement. Ohio may have some disheartening data, but it also has some solid policies in place—and that’s a good place to start.


