Mobile Navigation

  • National
    • Policy
      • High Expectations
      • Quality Choices
      • Personalized Pathways
    • Research
    • Commentary
      • Gadfly Newsletter
      • Flypaper Blog
    • Events
    • Scholars Program
  • Ohio
    • Policy
      • Priorities
      • Media & Testimony
    • Research
    • Commentary
      • Ohio Education Gadfly Biweekly
      • Ohio Gadfly Daily
  • Charter Authorizing
    • Application
    • Sponsored Schools
    • Resources
  • About
    • Mission
    • Board
    • Staff
    • Career
Home
Home
Advancing Educational Excellence

Main Navigation

  • National
  • Ohio
  • Charter Authorizing
  • About

Ohio Menu

  • Topics
    • Accountability & Testing
    • Advanced Education
    • Career & Technical Education
    • Charter Schools
    • Curriculum & Instruction
    • ESSA
    • Evidence-Based Learning
    • Governance
    • Personalized Learning
    • Private School Choice
    • School Finance
    • Standards
    • Teachers & School Leaders
  • Research
  • Policy
  • Commentary
    • Ohio Gadfly Newsletter
    • Ohio Gadfly Blog
    • Events

The Education Gadfly Weekly

Sign Up to Receive Fordham Updates

We'll send you quality research, commentary, analysis, and news on the education issues you care about.
Thank you for signing up!
Please check your email to confirm the subscription.

Ohio Education Gadfly Biweekly Volume 10, Number 16

Volume 10, Number 16
8.2.2016
8.2.2016

Ohio Education Gadfly Biweekly Volume 10, Number 16

Volume 10, Number 16
view
Quality Choices

Enrollment and Achievement in Ohio's Virtual Charter Schools

This Fordham study, conducted by learning technology researcher June Ahn from NYU, dives into one of the most promising—and contentious—issues in education today: virtual schools. What type of students choose them? Which online courses do students take? Do virtual schools lead to improved outcomes for kids?

June Ahn, Ph.D. 8.2.2016
NationalReport

Enrollment and Achievement in Ohio's Virtual Charter Schools

8.2.2016
Report

Where are Ohio’s teachers when we need them?

Jamie Davies O'Leary | Elaine Laux
8.8.2016
Blog

Is the new federal testing pilot worth the work?

Jessica Poiner
8.2.2016
Blog

Some Assembly Required: Piecing Together the Preparation Preschool Teachers Need

Jeff Murray
8.5.2016
Blog

Help shape educational accountability in Ohio

Ohio Education Gadfly
8.8.2016
Blog

What is competency-based funding, and how could Ohio implement it?

Sarah Souders | Aaron Churchill
8.8.2016
Blog

Three recommendations to improve online charter schools

Dara Zeehandelaar Shaw, Ph.D. | Michael J. Petrilli
8.3.2016
Flypaper
view

Where are Ohio’s teachers when we need them?

Jamie Davies O'Leary, Elaine Laux 8.8.2016
Blog
view

Is the new federal testing pilot worth the work?

Jessica Poiner 8.2.2016
Blog
view

Some Assembly Required: Piecing Together the Preparation Preschool Teachers Need

Jeff Murray 8.5.2016
Blog
view

Help shape educational accountability in Ohio

Ohio Education Gadfly 8.8.2016
Blog
view

What is competency-based funding, and how could Ohio implement it?

Sarah Souders, Aaron Churchill 8.8.2016
Blog
view

Three recommendations to improve online charter schools

Dara Zeehandelaar Shaw, Ph.D., Michael J. Petrilli 8.3.2016
Flypaper
view

Enrollment and Achievement in Ohio's Virtual Charter Schools

8.2.2016
Report

This Fordham study, conducted by learning technology researcher June Ahn from NYU, dives into one of the most promising—and contentious—issues in education today: virtual schools. What type of students choose them? Which online courses do students take? Do virtual schools lead to improved outcomes for kids?

With over thirty-five thousand students enrolled in its fully online charter schools (“e-schools”), Ohio boasts one of the country’s largest populations of full-time virtual students. The sector has also grown tremendously, with a 60 percent increase in enrollment over the past four years—more than any other type of public school. Using four years of comprehensive student-level data to examine Ohio’s e-schools, the study finds: 
 

  • E-school students are mostly similar in race and ethnicity to students in brick-and-mortar district schools. But e-school students are lower-achieving (and more likely to have repeated the prior grade), more likely to participate in the federal free and reduced-price lunch program, and less likely to participate in gifted education.
     
  • Students taking online math courses are more likely to enroll in basic classes relative to students taking face-to-face courses. Almost no students take advanced math courses (like AP Statistics, Calculus, or Algebra II) online, especially compared to students who take face-to-face classes.
     
  • Across all grades and subjects, students who attend e-schools perform worse on state tests than otherwise-similar students who attend brick-and-mortar district schools, even accounting for prior achievement. In contrast, students in grades 4–8 who attend brick-and-mortar charter schools perform slightly better than their district school counterparts in both reading and math. Results are mixed but modest for students in grade ten.
     
  • Findings also suggest that e-schools drag down the performance of the entire charter sector.

Online schools offer an efficient way to diversify—and even democratize—education in a connected world. Yet they have received negative, but well-deserved, attention concerning their poor academic performance, attrition rates, and ill capacity to educate the types of students who enroll in them. This is especially true in Ohio, where virtual schools have failed (as yet) to realize their potential.

Using a slightly different analytical approach than CREDO’s Online Charter School Study (2015), Dr. Ahn’s results corroborate the disappointing findings on Ohio’s online schools. Bold changes in policy and practice are needed to ensure that these schools better serve their students. For advocates of online learning and educational choice, the work has just begun.

view

Where are Ohio’s teachers when we need them?

Jamie Davies O'Leary | Elaine Laux
8.8.2016
Blog

Chronic absenteeism among students elicits serious concern for good reason. When pupils miss many days of school, they risk falling behind. This further puts them at risk of dropping out or being sucked into the criminal justice system through truancy proceedings, which is punitive for both students and their parents. (A bill proposed earlier this year would decriminalize truancy; Ohio lawmakers should revisit it soon.)

If attendance is so critical for students, isn’t it even more critical for teachers—especially since they are the most important in-school factor impacting student success? Yet data from the latest Civil Rights Data Collection (CRDC), a federal survey of all public schools in the country, demonstrates that teacher absenteeism is a pressing problem nationally and in Ohio.

We learn from the CRDC report (from the 2013–14 school year) that 28 percent of Ohio public school teachers (in traditional public and charter schools) were absent for ten or more days for sick or personal leave. This compares to 27 percent of teachers nationally. CRDC does not count paid professional development, field trips, or other off-campus activities with students, nor does this estimate include paid holidays or paid vacation time.

Is teacher absenteeism concentrated in particular districts and schools, or is it generally widespread? In how many of Ohio’s 3,600 schools is it a serious problem? The table presents a brief analysis of statewide findings.

[[{"fid":"116731","view_mode":"default","fields":{"format":"default"},"type":"media","link_text":null,"attributes":{"height":"429","width":"1200","style":"width: 600px; height: 215px;","class":"media-element file-default"}}]]
 

*These numbers are cumulative: the forty-seven schools where 90 percent or more teachers missed ten or more days are also included in the previous columns.

The findings show that teacher absenteeism is widespread across the state, and is an urgent problem in at least several hundred schools. Yes, we should be cautious in drawing too many interpretations; this data is from one year and there could be reasonable explanations for variance (especially among small schools). For example, a school may have had lots of teachers on maternity leave, or experienced an outbreak of flu.

Still, it’s apparent that many districts face challenges with teacher attendance, some far worse than others. Graph 1 (below) provides data for Ohio’s “Big 8” urban districts to illustrate the range and severity of the problem, especially in Cleveland. We should be particularly concerned about teacher attendance in districts like these, which serve large percentages of low-income students and students of color, youngsters for whom quality learning time is particularly critical.

Graph 1: Percentage of teachers missing ten or more days, Ohio “Big 8” urban districts (2013–14)

[[{"fid":"116732","view_mode":"default","fields":{"format":"default"},"type":"media","link_text":null,"attributes":{"height":"424","width":"614","style":"width: 500px; height: 345px;","class":"media-element file-default"}}]]

At least four of Ohio’s Big 8 urban districts—Canton, Cleveland, Columbus, and Toledo—had serious problems with teacher attendance during the school year studied. Cleveland’s astounding—appalling—numbers are backed by a 2014 report by the National Council for Teacher Quality (NCTQ) that ranked Cleveland as second worst nationally in terms of chronic teacher absenteeism, defined as teachers missing eighteen or more days. (The NCTQ report relied on an older version of the CRDC data.) In that report, more than a quarter of Cleveland teachers were chronically absent. However, the relatively low numbers in Akron, Dayton, and Youngstown suggest that sky-high absentee rates don’t have to be the norm in urban schools. In fact, the NCTQ report found no relationship between teacher absenteeism and school poverty rates.

Graph 2 depicts the percentage of teachers missing ten or more days in Ohio’s ten largest districts outside the Big 8. These districts are varied in the number of disadvantaged students they serve and seem to align with NCTQ’s previous finding that more-privileged districts sometimes also struggle on the teacher attendance front. Districts marked with asterisks were ranked among the thirty wealthiest in the state. As you can see, even Olentangy Local Schools, a suburban district outside of Columbus in which just 7 percent of students are poor, had almost a third of its teachers miss ten days or more. A quick glance at several other posh districts around the state reveals a similar pattern: Bexley—31 percent; Upper Arlington—30 percent; New Albany—24 percent; Beachwood—43 percent; Oakwood—26 percent; Chagrin Falls—18 percent. This puts them in worse standing on teacher absenteeism than about half of Ohio’s most challenged urban districts. Discounting Cleveland, which clearly skews the “Big 8” urban average, Ohio’s urban districts (Graph 1) actually had fewer teachers missing ten or more days of school (33 percent) than the top ten districts (36 percent) (Graph 2).[1]

Graph 2: Percentage of teachers missing ten or more days, Ohio’s largest (non-Big 8) districts (2013–14)

[[{"fid":"116733","view_mode":"default","fields":{"format":"default"},"type":"media","link_text":null,"attributes":{"height":"391","width":"619","style":"width: 500px; height: 316px;","class":"media-element file-default"}}]]

The costs of teacher absenteeism are immense, totaling more than $4 billion annually for the country as a whole, according to a 2012 report from the Center for American Progress. In Cleveland, the minimum cost of substitute teachers alone is anywhere from $3 to $6 million annually—and likely much higher.[2] Taken to scale, the 29,500 Ohio teachers—28 percent of the state’s total teaching workforce—who missed ten or more days in 2013–14 created monumental costs for districts and taxpayers.[3] Beyond the cost of hiring substitutes, teacher absenteeism takes a toll on school culture. It communicates to staff and students alike that attendance isn’t a priority—and thus may inspire others to take more days and make absenteeism and truancy the norm. When substitutes aren’t available, it creates enormous burdens on fellow teachers who have to teach additional students, or miss planning or break periods to cover for their colleagues. And it disrupts student learning. When any teacher—let alone the majority in a school building—miss 5 or 10 percent of the school year, you can bet that students are missing out instructionally and that the scope and sequences of key subjects is heavily disrupted.

One likely reason that schools have so many absent teachers on a given day is because the leave provisions set forth in collective bargaining agreements tend to be generous. Cleveland’s collective bargaining agreement, for example, allots eighteen paid sick days and three paid personal days out of 185 instructional days (a whopping 11 percent of the school year). Compare this to the average sick time for private sector employees (ten days and possibly a handful of personal days), or for state employees (ten sick days and four personal days)—who work on average eighty days more than teachers. In addition, most contracts allow extensive sick leave accumulation from year to year; consider Dayton Public Schools’ recent  $149,000 sick leave payout to its outgoing superintendent as just one example.

It’s also noteworthy that the teacher absenteeism problem seems to be most acute in traditional public schools bound by collective bargaining agreements. Among the 330+ charter schools in the study—almost none of which has a labor contract—not a single one had very high rates of teacher absenteeism (defined as 75 percent or more missing ten days). Fewer than 2 percent saw half their teachers miss ten days, even though many charter schools have longer work days and school years and their teachers have the same working conditions that make sickness likely, such as germ exposure and sheer exhaustion (in fact, charter educators may have tougher working conditions because their schools can only be located in Ohio’s academically and economically challenged communities). The charter comparison data suggest that the culture in unionized traditional public schools has made high rates of absenteeism the norm in many schools. 

If we are serious about ensuring that more students receive solid instruction and stay on pace, curbing teacher absenteeism must be a priority. Teacher unions responsible for negotiating such generous leave policies should consider the adverse impact such policies have on students. Districts should work hard to improve teacher attendance. And teachers themselves should recognize how much is at stake when they take significant leave beyond the generous vacation, paid professional development, and vacation time allotted to them. When it comes to raising student achievement—especially those for whom so much hangs in the balance—there can be no sacred cows.

Update, August 9, 2016:
To access the CRDC Ohio data for your own school or district, go here. Data are reported for schools but can easily be calculated to find district averages. Column YA ("SCH_FTETEACH_TOT") is the total number of FTE teachers. Column YG ("SCH_FTETEACH_ABSENT") is the number of FTE teachers who were absent more than 10 school days during the school year. Column YH is an added column that calculates the percentage of each school's total FTE teachers missing 10 or more school days.

[1] The average for the Big 8 urban districts, including Cleveland, is 45 percent.

[2] In the 2013–14 CRDC survey, 2,288 Cleveland teachers missed ten or more school days. If we err on the conservative side and assume all of those teachers missed only ten days (even though we know that’s not the case given the high chronic absentee rate reported in the NCTQ report), at a daily substitute rate of $129 to 144 (not including long-term sub rates, which are higher) the district would have paid $2.95 million to $3.3 million for substitute teachers alone. Assuming each of those teachers were absent an average of fourteen days, the costs would be more in the ballpark of $4.1 to $4.6 million. If those teachers averaged eighteen days, the cost would be $5.3 to $5.9 million. Of course this also leaves out any additional overhead costs and the cost of longer-term absences beyond the eighteen days.

[3]If 29,500 teachers each took ten days (the minimum), that’s 295,000 substitutes across the year. If substitutes were found for only 250,000 cases, at a cost of $120 per day (far lower than Cleveland’s average), that totals $30 million annually. And the actual cost is probably much higher.


view

Is the new federal testing pilot worth the work?

Jessica Poiner
8.2.2016
Blog

Many education stakeholders see the Every Student Succeeds Act (ESSA) as an opportunity to fix the most problematic provisions in NCLB. For many critics, the biggest bogeyman was too much standardized testing and its associated accountability measures. While ESSA maintains the annual testing requirements, it also offers new flexibilities. Among these is the opportunity to apply for the Innovative Assessment Pilot (IAP).

IAP is a provision that permits states to pilot an innovative assessment system in place of a statewide achievement test. “Innovative” is an umbrella term that covers a plethora of different testing options, including (but not limited to) competency-based, instructionally embedded, and performance-based assessments. Regardless of the assessment type chosen by a state, it must result in an annual, summative score for a student. Authority to participate in the pilot—known as “demonstration authority”—will be granted through an application process run by the secretary of education. No more than seven states will be allowed to participate in the pilot for a period of up to five years, with the option to apply for an additional two-year extension.[1]

Folks who are worried that states might use the pilot to weaken state accountability systems will be happy to learn that ESSA establishes guardrails that make that unlikely. As part of the application process, states must demonstrate how they will “validly and reliably aggregate data from the innovative assessment system for purposes of accountability,” specifically the new law’s statewide accountability requirements. The results must also be valid, reliable, and comparable “as compared to the results for such students on the state assessment.”[2] Does that mean that students are double testing—taking both the statewide assessment and the innovative assessment—during the pilot? Yes and no. According to a recent blog post in Education Week, the department’s proposed regulations give states four options for comparing their pilot assessment to their previous statewide test:

  1. States could give the state test once per grade span (but not every grade) in which students take an innovative test (like New Hampshire).
  2. States could give both the state test and the innovative test in certain grades, but they aren’t required to give both tests to every student—they could administer the state test to a representative group.
  3. States could utilize similar questions or items on both the state test and the innovative test.
  4. States could create their own equally rigorous comparability measure.

States can opt to initially run the pilot in a subset of districts rather than statewide (proposed regulations also permit states to focus on a certain grade or a certain subject). However, the innovative assessment system must be scaled statewide by the end of the pilot period, and states must prove throughout the course of the pilot that there is a “high-quality” transition plan for statewide implementation in place.

The requirements for statewide scalability and inclusion in the statewide accountability system might be two serious deterrents for states that were only halfheartedly considering an application. The fact that there may not be any federal funding to help states implement the pilot is another drawback. And for those brave remaining states that are still interested, the extensive application process could change their thinking. The application’s basic requirements include descriptions of the innovative system a state plans to use, experience the state has with all components of the system, and the planned timeline. Sounds easy enough, right? But check out a few additional items that states must demonstrate in their applications:[3]

  • The system must generate results that are valid, reliable, and comparable for all students and subgroups.
  • The system must be developed in collaboration with teachers, school leaders, local districts, parents, civil rights organizations, and stakeholders that represent the interests of students with disabilities, English language learners, and other vulnerable students.
  • The system must annually assess the same percentage of students and subgroups enrolled in schools under IAP that would be assessed under other state testing requirements.
  • States must describe how they will support teachers in developing and scoring pilot assessments.
  • States must describe how they will solicit regular feedback from teachers, school leaders, and parents and how it will respond by making needed changes.

So what about Ohio? Should the Buckeye State roll up its sleeves and dive into the IAP application? Some education advocacy groups have said yes, and with good reason. Ohio is already part of the Innovation Lab Network, which aims to implement student-centered learning approaches. Ohio law already permits the state superintendent to grant waivers to schools interested in piloting an alternative assessment system. The state also boasts a competency-based education pilot and the Ohio Performance Assessment Pilot Project. In short, Ohio seems like the perfect state to take on IAP.

But a solid foundation doesn’t always indicate that it’s time to build a house—and Ohio’s work with innovative assessments doesn’t mean that the state should jump at participating in IAP. Ohio schools are still reeling from administering three separate statewide assessments in as many years. Safe harbor has been in effect since 2014–15, which was the same year that our current standards were first implemented in full. Our current accountability system has reported on, but never actually held schools accountable for, those state standards and their aligned assessments. And speaking of state standards, the Ohio Department of Education (ODE) is presently revising them. According to ODE, schools will be transitioning to revised math and ELA standards during the 2017–18 school year—the same year that IAP could be starting. Add to that the myriad other changes that are quickly approaching with ESSA, and the Buckeye State looks to have plenty on its plate in the coming years even without the huge undertaking of IAP.

To be clear, I’m not saying that Ohio can’t successfully pilot an innovative assessment system. I’m saying that maybe we shouldn’t—at least not yet. The IAP provisions state that three years into the program, the Institute of Education Sciences (IES) must publish a report that examines whether the innovative assessment systems have been successful. The findings from this report will be used to establish a peer review process that will extend the pilot to additional states. Ohio could be one of the first states to apply for the second round of IAP demonstration authority. In the meantime, ODE could focus on getting the rest of ESSA implementation right.

Passing on the first round of the pilot doesn’t mean that Ohio has to abandon its work with innovative assessments either. While gathering stakeholder input for ESSA implementation, the department could gauge interest and ideas for an innovative assessment without the pressure of a looming application deadline and the potential of increased federal oversight in state assessment policy. The results from Ohio’s competency-based education pilot and the Ohio Performance Assessment Pilot Project could be gathered and examined, and Ohio could watch and learn from PACE in New Hampshire and the first round of IAP states.

In short, this may be a good time to observe rather than act. Supporters of innovative assessments often value them because they’re different from standardized tests. But opting for something different also means losing out on the features that made standardized tests so popular in the first place—they’re cheap, reliable, easy to administer, and they make comparing results simple. If we’re serious about making innovative assessments work for Buckeye students, we have to pick the right time to invest in them—not just jump at the first chance we get.


[1] States are permitted to apply as part of a consortium, but a consortium can’t exceed four states, and the limit to the total amount of states participating in the pilot remains the same. The secretary of education determines the official start of the pilot, though 2017–18 is the earliest date.

[2] Although states are permitted to use the results from their innovative assessment as part of their accountability system, they are not required to do so—at least not initially. The USDOE’s proposed regulations regarding IAP make clear that the purpose of the program is to eventually use the innovative assessment system to “meet the academic assessment and statewide accountability system requirements” of Title I.

[3] This list does not include all of the IAP application’s requirements. 

view

Some Assembly Required: Piecing Together the Preparation Preschool Teachers Need

Jeff Murray
8.5.2016
Blog

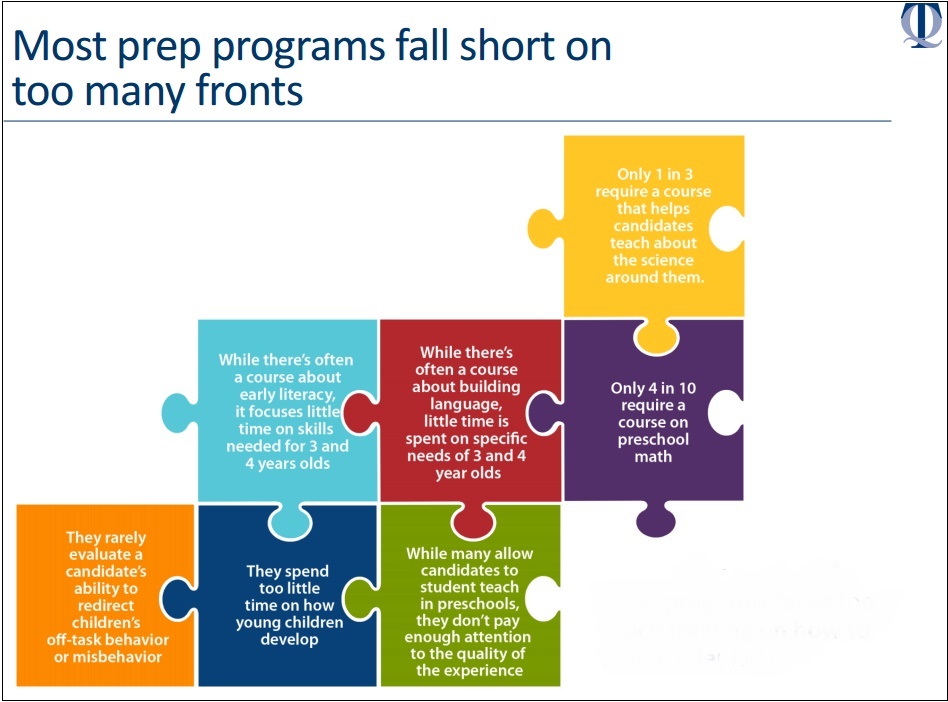
The National Council on Teacher Quality (NCTQ) recently reviewed one hundred of the nation’s pre-K teacher prep programs, attempting to answer whether pre-K teacher candidates are being taught what they need to know to be effective in their future jobs.[1] The answer is, largely, no. This should be sobering news, especially for folks here in Ohio as many head to the November ballot hell bent on expanding pre-K.

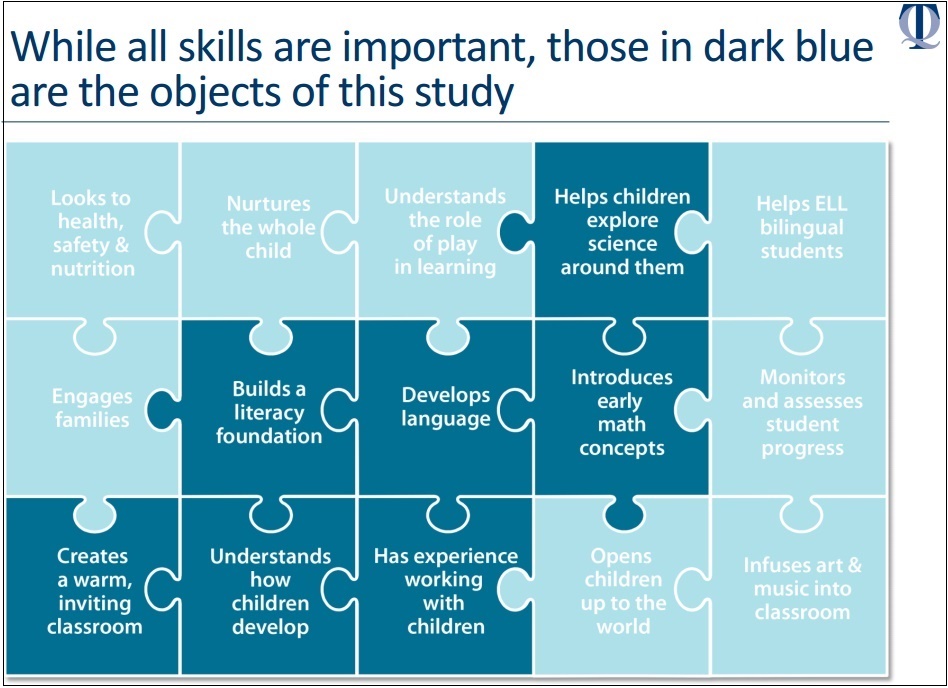
The bottom line, reported NCTQ, is that most of the programs reviewed spend far too much of their limited time on how to teach older children rather than on the specific training needed to teach three- and four-year-olds. Some specific findings are neatly summarized in the following slides from NCTQ:

Image 1

Image 2

NCTQ recommends, among other things, that states narrow their licensure to certify educators for no more than pre-K through third grade (as Ohio already does), rather than treating pre-K as a part of an overall elementary credential; that they encourage teacher prep programs to offer either more-specialized degrees or early childhood education as an add-on endorsement; that they ensure that prep programs require courses in critical areas such as emergent literacy, early childhood development, or early math and science; and that they encourage future pre-K educators to do their student teaching with rock star teachers.

All good suggestions, but all heavy lifts, especially for a state like Ohio, whose teacher prep programs aren’t so hot anyway.

Perhaps Ohioans keen to expand pre-K should first make sure they’ve got the makings of a competent workforce to do the job right. If we’re going to put a lot of ed-reform eggs into the pre-K basket, that basket better be strong and well-stocked.

SOURCE: Hannah Putman, Amber Moore, Kate Walsh, “Some Assembly Required: Piecing Together the Preparation Preschool Teachers Need,” National Council on Teacher Quality (June 2016).


[1] Researchers examined one hundred programs in twenty-nine states that certify pre-K teachers, most of them offering bachelor’s and master’s degrees. They reviewed course requirements and descriptions, course syllabi, student teaching observation and evaluation forms, and other course materials required for degree completion.

view

Help shape educational accountability in Ohio

Ohio Education Gadfly
8.8.2016
Blog

You're invited to join in the conversation and contribute to Ohio’s Every Student Succeeds Act (ESSA) plan.

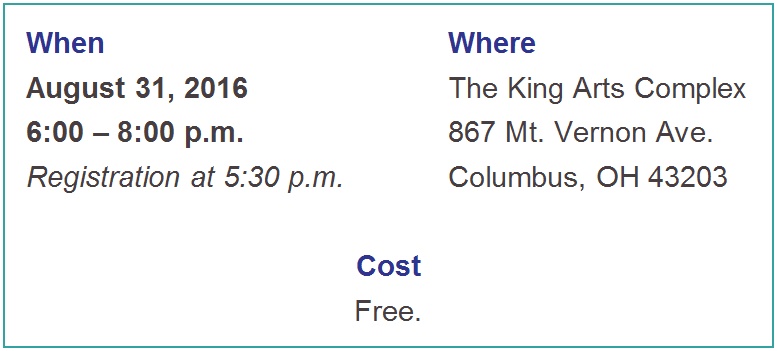
Meeting info

Engage in a regional meeting to share your thoughts and perspective on the Every Student Succeeds Act (ESSA) and Ohio’s developing state plan. This meeting is an exciting opportunity to gather valuable input from various perspectives from local educators, funders, parents, students and community members. The meeting will include an introduction from state superintendent Paolo DeMaria, a brief overview of ESSA and group discussions around specific provisions and options.

ESSA, which passed Congress with bipartisan support and was signed into law by President Obama on Dec. 10, 2015, replaced the No Child Left Behind Act. It has shifted broad authority from the federal government to state and local agencies, providing them with greater flexibility and decision-making power. Ohio’s state plan, which is required by ESSA, will be submitted to the federal government in 2017 and will address topics such as standards, assessments, accountability and assistance for struggling schools.

This regional conversation is one of a series of conversations Philanthropy Ohio and its members, in partnership with the Ohio Department of Education, are convening across the state.

Join us for this important conversation, a tremendous opportunity for us to collectively discuss ESSA and how it will impact our students, educators and families in Ohio.

Header

Registration

Register at http://columbusessa.eventbrite.com and share this invitation with colleagues and friends.

Cost

Philanthropy Ohio Members: Free

Eligible Non-members: Free

Registration Deadline

August 24

Questions?

Please email Adrienne Wells ([email protected]) or call 614.914.2249

The Thomas B. Fordham Institute is proud to co-host this ESSA stakeholder meeting for the central Ohio region.  Your input will be vital as the state redefines accountability in the post-No Child Left Behind era.

view

What is competency-based funding, and how could Ohio implement it?

Sarah Souders | Aaron Churchill
8.8.2016
Blog

Competency-based education has attracted attention as a “disruptive innovation” that could remake American schools. Under this model, students move through the curriculum at their own speed by demonstrating competency as determined by the instructor or other assessment tools. At a high-school level, competency can replace the traditional “seat time” method of bestowing credit, a policy that New Hampshire has adopted. Competency-based education allows students of any age to accelerate their learning progress once they master a topic, while enabling them to slow down in an area where they need more work.

Funding based on competency is widely seen as a way to finance e-schools or online course access programs. It could also be used to fund schools that focus on dropout recovery—whether online or brick-and-mortar. Competency-based funding would offer schools (or course providers) incentives to focus on student learning. It would also fit well with the flexible nature of online or dropout recovery programs. But if Ohio policy makers consider the competency-based funding route, what are the design alternatives? A good starting point is to examine the models other states have already piloted. This article offers an overview of what four states have done—Utah, New Hampshire, Florida, and Minnesota—in the hopes of stirring thought about the pathways Ohio might take.

Nota bene: In some cases, the state’s funding model is probably more accurately described as “completion-based”—funding premised on course completion, not necessarily a demonstration of competency (which, as we’ll see in the case of New Hampshire, can be split into competencies within a course). Together, competency- and completion-based funding are sometimes called “performance based” funding. For an excellent review of these distinctions and other policy considerations, see iNACOL’s Performance-Based Funding & Online Learning report.

Utah

The interesting features of Utah’s approach are its differentiation of course-level funding based on the subject matter, and a payment schedule based on three milestones during a student’s course enrollment. Applying only to online courses for students in grades 9–12, Utah allocates funds based on the number and types of courses that students choose. The amount of funding tied to each course depends on its “cost category.” These range from up to $200 per half-credit for health, fitness, and computer literacy to $350 per half-credit for courses such as English language arts, math, and science. (These amounts may be adjusted annually.) Utah disburses funds in the following manner: Confirmation of enrollment accounts for 25 percent of the course allocation; continuation or “active participation” as determined by the provider (either the student’s school district or charter school) releases another 25 percent; and 50 percent of the funding is awarded upon course completion, which hinges on students’ passage of the course as determined by their instructor.

New Hampshire

New Hampshire focuses on competency in its funding of online education. Funding is determined by the number of competencies, or discrete topics, that a course’s students master, as verified by an online instructor. Each one-credit high school course students complete through the state’s online school, known as the Virtual Learning Academy Charter School (VLACS), includes eight competencies that students must master before they pass the entire course. This benchmarking of progress allows for partial funding at the course level. If students master all the competencies in a course, VLACS receives the full appropriation. If not, VLACS receives partial payment based on the fraction of competencies the student achieved. Each half-credit, semester-long course was worth a maximum of $454 in 2014–15.

To illustrate this approach, the table below displays a hypothetical example. George reaches the end of the year meeting only 25 percent competency in the course, so VLACS receives just $113.50. Sam, however, met all the required competencies, releasing the entire per-course allotment.

Table 1. Example of VLAC’s Funding Formula for a half-credit (or semester-length) course

[[{"fid":"116739","view_mode":"default","fields":{"format":"default"},"type":"media","link_text":null,"attributes":{"height":"253","width":"918","style":"width: 500px; height: 138px;","class":"media-element file-default"}}]]

Florida

Unlike Utah and New Hampshire, which allocate partial payments, the Florida Virtual School (FLVS) only receives funds upon course completion, as determined by the teacher and passage of a statewide end-of-course assessment, if applicable. Course funding for FLVS is determined in the following way: The state’s weighted per-pupil amount is divided by six—the number of credits equal to a full load. If only one credit is completed online, the virtual school receives a one-sixth share of the per-pupil allocation (contingent upon course completion). FLVS submits five enrollment estimates throughout the year and receives twice-monthly payments based on these estimates, assuming full course completion. The final enrollment calculation occurs at year’s end, and adjustments are determined based on confirmation of course completion.

Minnesota

Minnesota’s online-learning program also provides funding based on course completion. But unlike Utah, Florida, and New Hampshire—which created single, statewide online education providers—Minnesota certifies multiple, independent entities to serve either as fulltime online schools or as providers of supplemental courses (to students primarily enrolled in a traditional district or charter school). Currently, thirty-two online schools have been approved by the state. Each of them sets its own definitions for course completion, and the Minnesota Department of Education is responsible for verifying the completion of courses. Minnesota’s use of many providers is more akin to Ohio’s online learning environment, with its many e-schools, and could serve as a model, especially if Buckeye policy makers consider making individual online courses available to Ohio students.

***

Competency-based funding holds much potential, but it represents a very different financing arrangement vis-à-vis traditional funding models typically predicated on headcounts. Sensibly, a few states have piloted this approach in online-learning environments. The design and implementation details are, as always, critical, and the nascent efforts of four other states offer models that Ohio policy makers could look toward. In so doing, they should weigh several questions: At what dollar amount should each course be funded, and should they be funded differently by content area? Should the state provide partial payments throughout the duration of the course, a lump-sum payment after a student completes the course, or “business as usual” payments that assume full completion and then require repayment if a student fails to complete the course? How does a state verify that a student has achieved “competency” or successfully completed a course—by instructor verification, a state-approved end-of-course exam, or some combination of both? (Caveat emptor: Pure instructor verification appears to create a conflict of interest. If teachers know that their school’s funding hinges on the grades they award, they might inappropriately pass undeserving pupils.) These—and many more—are questions that policy makers ought to wrestle with. Fortunately, Ohio lawmakers can look to a few other states that are blazing new trails in competency-based education and funding models that align to it.

view

Three recommendations to improve online charter schools

Dara Zeehandelaar Shaw, Ph.D. | Michael J. Petrilli
8.3.2016
Flypaper

A major development of recent years has been the explosive growth of online learning in K–12 education. Sometimes it takes the form of “blended learning,” with students receiving a mix of online and face-to-face instruction. Students may also learn via web-based resources like the Khan Academy, or by enrolling in distance-learning “independent study” courses. In addition, an increasing number of pupils are taking the plunge into fully online schools: In 2015, an estimated 275,000 students enrolled in full-time virtual charter schools across twenty-five states.

The Internet has obviously opened a new frontier of instructional possibilities. Much less certain is whether such opportunities are actually improving achievement, especially for the types of students who enroll in virtual schools. In Enrollment and Achievement in Ohio's Virtual Charter Schools, we at Fordham examined this issue using data from our home state of Ohio, where online charter schools (“e-schools”) are a rapidly growing segment of K–12 education. Today they enroll more than thirty-five thousand students, one of the country’s largest populations of full-time online students. Ohio e-school enrollment has grown 60 percent over the last four years, a rate greater than any other type of public school. But even since they launched, e-schools have received negative press for their poor academic performance, high attrition rates, and questionable capacity to educate the types of students who choose them. It’s clearly a sector that needs attention.

Our study focuses on the demographics, course-taking patterns, and academic results of pupils attending Ohio’s e-schools. It was authored by Dr. June Ahn, an associate professor at New York University’s Steinhardt School of Culture, Education, and Human Development. He’s an expert in how technology can enhance how education is delivered and how students learn.

Using student-level data from 2009–10 through 2012–13, Dr. Ahn reports that e-schools serve a unique population. Compared to students in brick-and-mortar district schools, e-school students are initially lower-achieving (and more likely to have repeated the prior grade), more likely to participate in the federal free and reduced-price lunch program, and less likely to participate in gifted education. (Brick-and-mortar charters attract even lower-performing students.)

The analysis also finds that, controlling for demographics and prior achievement, e-school students perform worse than students who attend brick-and-mortar district schools. Put another way, on average, Ohio’s e-school students start the school year academically behind and lose even more ground (relative to their peers) during the year. That finding corroborates the disappointing results from Stanford University’s Center for Research on Education Outcomes (CREDO) 2015 analysis of virtual charter schools nationwide, which used a slightly different analytical approach.

Importantly, this study considers e-school students separately from those in other charters. It finds that brick-and-mortar charter students in grades 4–8 outperform their peers in district schools in both reading and math. In high school, brick-and-mortar charter students perform better in science, no better or worse in math, and slightly worse in reading and writing compared to students in district schools. This confirms what some Ohioans have long suspected: E-schools weigh down the overall impact of the Buckeye State’s charter sector. Separate out the e-school results and Ohio's brick-and-mortar charters look a lot better than when the entire sector is treated as a whole.

The consistent, negative findings for e-school students are troubling, to say the least. One obvious remedy is to pull the plug—literally and figuratively—but we think that would be a mistake. Surely it’s possible, especially as technology and online pedagogy improve, to create virtual schools that serve students well. The challenge now is to boost outcomes for online learners, not to eliminate the online option. We therefore offer three recommendations for policy makers and advocates in states that, like Ohio, are wrestling to turn the rapid development of online schools into a net plus for their pupils.

First, policy makers should adopt performance-based funding for e-schools. When students complete courses successfully and demonstrate that they have mastered the expected competencies, e-schools would get paid. This creates incentives for e-schools to focus on what matters most—academic progress—while tempering their appetite for enrollment growth and the dollars tied to it. It would also encourage them to recruit students likely to succeed in an online environment—a form of “cream-skimming” that is not only defensible but, in this case, preferable. At the very least, proficiency-based funding is one way for e-schools to demonstrate that they are successfully delivering the promised instruction to students. That should be appealing to them given the difficulty in defining, tracking, and reporting “attendance” and “class time” at an online school.

Second, policy makers should seek ways to improve the fit between students and e-schools. Based on the demographics we report, it seems that students selecting Ohio’s e-schools may be those least likely to succeed in a school format that requires independent learning, self-motivation, and self-regulation. Lawmakers could explore rules that exempt e-schools from policies requiring all charters, virtual ones included, to accept every student who applies and instead allow e-schools to operate more like magnet schools with admissions procedures and priorities. E-schools would be able to admit students best situated to take advantage of the unique elements of virtual schooling: flexible hours and pacing, a safe and familiar location for learning, a chance for individuals with social or behavioral problems to focus on academics, greater engagement from students who are able to choose electives based on their own interests, and the chance to develop high-level virtual communication skills. E-schools should also consider targeting certain students through advertising and outreach, especially if they can’t be selective. At the very least, states with fully online schools should adopt a policy like the one in Ohio, which requires such schools to offer an orientation course—the perfect occasion to set high expectations for students as they enter and let them know what would help them thrive in an online learning environment (e.g., a quiet place to study, a dedicated amount of time to devote to academics).

Third, policy makers should support online course choice (also called “course access”), so that students interested in web-based learning can avail themselves of online options without enrolling full-time. Ohio currently confronts students with a daunting decision: either transfer to a full-time e-school or stay in their traditional school and potentially be denied the chance to take tuition-free, credit-bearing virtual courses aligned to state standards. Instead of forcing an all-or-nothing choice, policy makers should ensure that a menu of course options is available to students, including courses delivered online. To safeguard quality and public dollars, policy makers should also create oversight to vet online options (and veto shoddy or questionable ones). Financing arrangements may need to change, too, perhaps in ways that more directly link funding to actual course providers. If it were done right, however, course choice would not only open more possibilities for students, but also ratchet up the competition that online schools face—and perhaps compel them to improve the quality of their own services.

Innovation is usually an iterative process. Many of us remember the earliest personal computers—splendid products for playing Oregon Trail, but now artifacts of the past. Fortunately, innovators and engineers kept pushing the envelope for faster, nimbler, smarter devices. Today, we are blessed as customers with easy-to-use laptops, tablets, and more. But proximity to technology, no matter how advanced, isn’t enough. E-schools and their kin should facilitate understanding of how best to utilize online curricula and non-traditional learning environments, especially for underserved learners. From this evidence base, providers should then be held to high standards of practice. Though the age of online learning has dawned, there is much room for improvement in online schooling—and nowhere more than in Ohio. For advocates of online learning, and educational choice, the work has just begun.

Fordham Logo

© 2026 The Thomas B. Fordham Institute
Privacy Policy
Usage Agreement

National

P.O. Box 110
Burke, VA 22009

202.223.5452

[email protected]

Ohio

P.O. Box 82291
Columbus, OH 43202

614.223.1580

[email protected]

Sponsorship

130 West Second Street, Suite 410
Dayton, Ohio 45402

937.227.3368

[email protected]