Over the past few years, education groups have pushed the General Assembly to walk back the state policy that requires all high school juniors to take the ACT or SAT exam. Earlier this year, House legislators introduced a bill that would eliminate this requirement (House Bill 82). While the lower chamber’s version of the state budget doesn’t go quite as far, it weakens the mandate by allowing students to bypass these exams with parent permission.
Opponents of universal testing have argued that not every student needs to take college entrance exams. They’re right in the sense that many young people can achieve their professional goals through technical training or an associate degree. But they are wrong to deny all students the opportunity to pursue admission into four-year universities. For many qualified students, a test-optional policy means they’ll go unidentified as a competitive candidate in the college admissions process, forestalling what could be attractive options for their futures. As we’ll see, students from groups that have been underrepresented in higher education are more likely to slip through the cracks when no one requires their participation.
Because Ohio only recently moved to universal testing, we can predict what is likely to occur if legislators were to reverse course. Figure 1 shows ACT participation rates for the class of 2017, the last cohort that was not subject to the exam requirement. The statewide participation rate was 56 percent, but we notice substantially lower rates for disadvantaged groups. Less than half of Ohio’s Black, Hispanic, economically disadvantaged, and English learners took the ACT. Not even a quarter of students with disabilities decided to take the test. In sum, a troubling “opportunity gap” emerges when test-taking is not required by the state.
The gap, however, narrowed when participation became mandatory for the class of 2018. ACT participation rates rose across the board, with 81 percent of Ohio students taking the test. (SAT test-taking and dropouts explain why the rate was not 100 percent.) While less advantaged groups still registered lower participation rates, more than three in five Black, Hispanic, economically disadvantaged, and English learners took the ACT. Students with disabilities experienced the largest jump in participation—from just 22 percent of the class of 2017 to 60 percent of the class of 2018.
Figure 1: ACT participation rates for the classes of 2017 and 2018, selected student groups
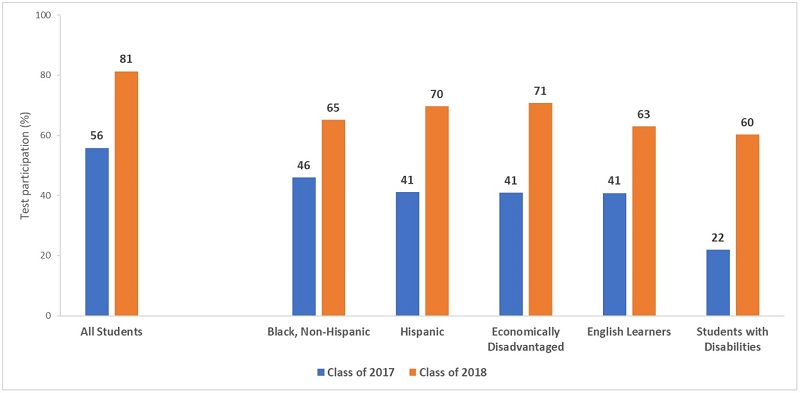
Note: Though fewer students take the SAT in Ohio, test participation rates on that exam also rose. For all students, SAT participation went from 6.5 percent for the class of 2017 to 12.0 percent for the class of 2018. These participation rates would include dropouts who did not take the ACT or SAT, likely explaining a less than 100 percent rate for the class of 2018.
The next figure shows the changes in test-participation rates across districts of varying geographic and socio-economic typologies. What’s interesting here is that poor rural and small town districts had relatively low participation rates when Ohio allowed testing to be optional. For example, just 54 percent of students in the classes of 2016 and 2017 from rural, high-poverty districts took the ACT when the exams were optional. The picture dramatically changed with the statewide testing requirement coming into effect. Now more than 90 percent of students in rural districts take the ACT.
Figure 2: ACT participation rates for the classes of 2016–17 and 2018–19, by district typology
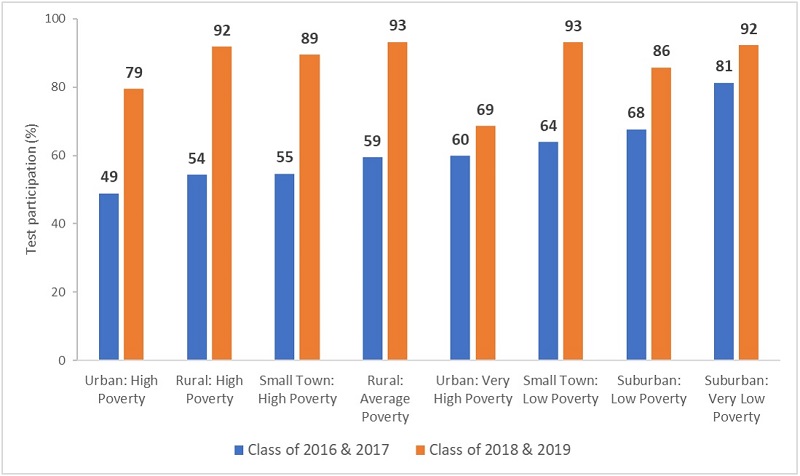
Note: ODE reports district-level test participation data that are combined across two graduating classes. The relatively small increase in the Urban: Very High Poverty typology is likely due to sizeable numbers of students taking the SAT in those districts. The chart displays an average participation rate for each typology that is weighted by the number of students in a district’s graduating class.
Some may argue that these “new” test takers are academically middling students who aren’t likely to succeed in higher education. The legislative sponsors of HB 82 seemed to suggest as much when they stated their belief that some students “do not take the test seriously.” In some circumstances, requiring students to sit for the exam may indeed be a questionable use of a time. But it’s not always the case. A Virginia analysis, for instance, found that a quarter of the students who skipped their college exams would have likely achieved competitive scores; a similar finding emerged when analysts looked at Michigan data. The latter analysis found that tens of thousands of low-income but academically talented students had not been taking the ACT or SAT. For these college-prepared students, it’s well worth the effort to ensure that they actually take these exams.
Unfortunately, no comparable research has been undertaken in Ohio. Thus, we don’t know the performance of students who did not take college exams prior to the statewide requirement. While a precise analysis would require student data, there are indications that a number of high-ability students skipped these college exams under a test-optional policy. Some districts, for example, posted proficiency rates that were significantly higher than their ACT participation rates. In Lorain School District, for example, just 16 percent of its classes of 2016 and 2017 took the ACT, but roughly double that number of students passed their high school EOCs in 2015–16. The same phenomenon can be seen in a number of largely rural and small-town districts where ACT participation rates were in the 40’s and 50’s, while proficiency rates were in the 60’s and 70’s.
As a matter of equal opportunity, all students should be given at least one shot to take college entrance exams that can open a lifetime of opportunity. A universal participation requirement ensures that this actually happens. Under such a policy, talented students don’t get shut out of colleges just because they didn’t realize the importance of taking these exams. Rather than trying to scrap this policy, lawmakers should take pride in the fact that they guarantee that every Ohio student has a chance to pursue higher education.