Since the inception of standardized tests in our schools, many debates have raged regarding their value. Critics often contend that schools are “testing students to death”, while supporters argue that testing allows for accountability at the student, teacher, and school level. The dispute may continue, but for now, let’s examine whether standardized test results provide any indication of the future educational attainment of the students who take them. It turns out that in districts across Ohio, proficiency on standardized tests (in both reading and mathematics) correlates moderately well with high school graduation and college remediation rates.
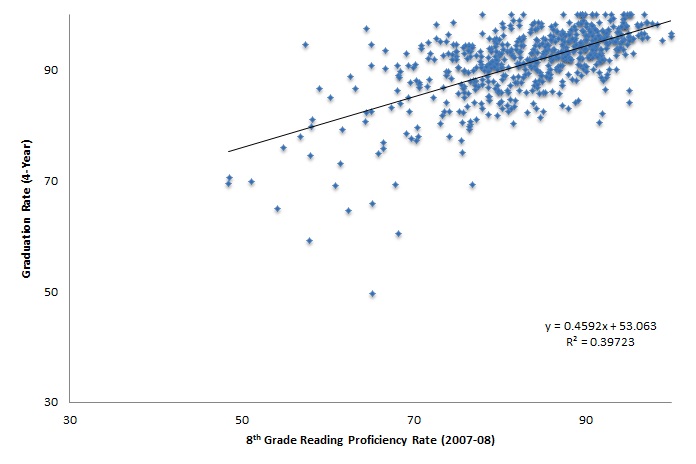
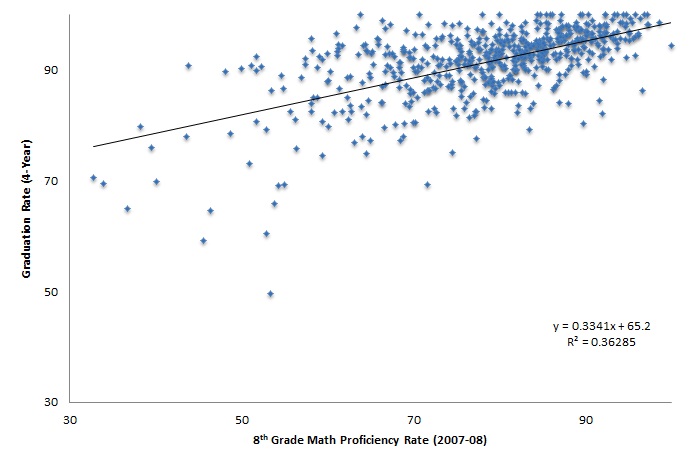
First, let’s examine the relationship between proficiency and high school graduation. Figure 1 represents the eighth-grade proficiency and graduation rate for each Ohio district as a point on the graph. Proficiency data from 2007-08 are paired with 2011-12 graduation rates, since eighth-grade students in spring 2008 were scheduled to graduate in spring 2012 under the conventional pathway to graduation.[1] For the most part, we observe a positive correlation between the two variables—the line that best fits the points trends upward. Our R-squared values[2] (the measure of the “goodness” of the trend lines’ fit through the points), and the correlation coefficients[3] indicate that this link is moderate in strength.
Districts with higher proficiency rates tend to have higher graduation rates and vice-versa. Generally speaking, this suggests that test results are linked to high-school graduation. Yet a district’s proficiency rate isn’t the only factor that helps predict its graduation rate, as a number of districts deviate considerably from the trend line.
Figure 1: 8th Grade Reading and Math Proficiency versus Graduation Rate, Ohio School Districts


Data source: Ohio Department of Education. Notes: Graduation data is from 2011-12. Eighth-grade math and reading proficiency is from 2007-08, since that cohort of students was on schedule to graduate high school in 2011-12.
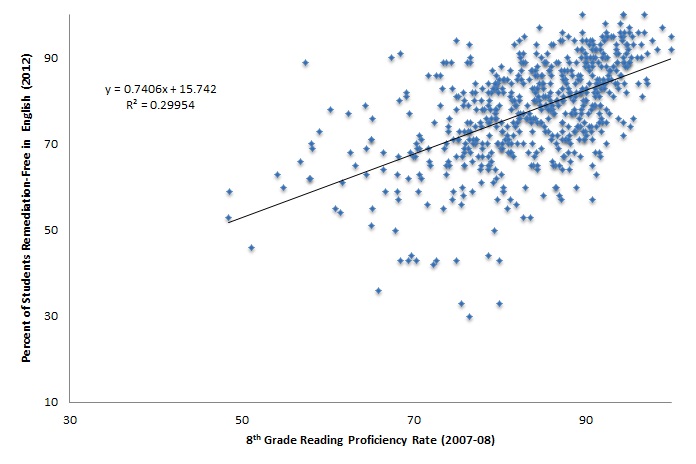
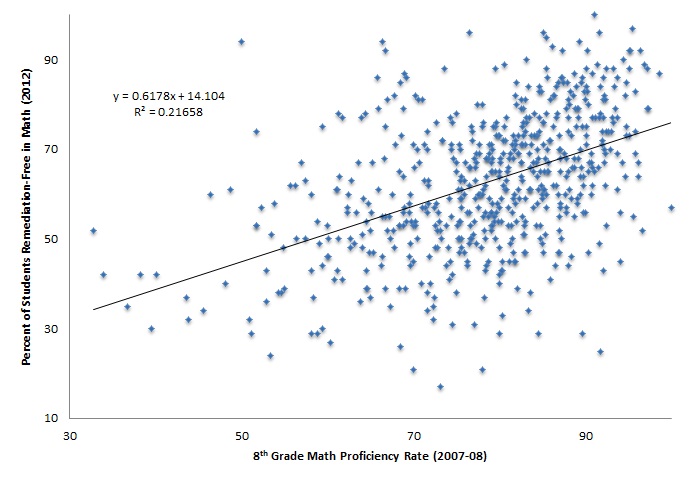
When we examine the relationship between proficiency and college remediation rates, we again observe correlation, albeit weaker than the proficiency-graduation correlation previously discussed. Figure 2 demonstrates the connection between eighth-grade proficiency and subsequent remediation rates (the percentage of incoming freshman requiring developmental coursework.) Once again, proficiency data from 2007-08 are utilized in order to compare the district’s cohort of college-going students who were scheduled to enroll as freshman in fall 2012. A district’s reading proficiency is compared to the percentage of a district’s college-going graduates who are not required to take a developmental English course (i.e. they are “remediation-free,” the inverse of the aforementioned “remediation rate”). A district’s proficiency and remediation-free rates in math are likewise compared.
Again, the data generally follow the expected pattern. For example, in both math and reading, high proficiency rates correlate positively with remediation-free rates, as the ascending trend lines demonstrate. The higher a district’s proficiency rate, the higher the rate of remediation-free students. But the relationship is weaker than the proficiency-graduation-rate link: the R-squared values are lower, as are the correlation coefficients.[4] A larger number of districts also appear to deviate substantially from the trend line. All this suggests that state test results matter somewhat less (relative to graduation rates), if being remediation free is our educational output of interest. So while students may have demonstrated proficiency on Ohio’s state exams, that accomplishment was no guarantee that they were remediation-free or college ready if they entered college.
Figure 2: 8th Grade Reading and Math Proficiency versus Remediation-Free Rates, Ohio School Districts


Data source: Ohio Department of Education and Ohio Board of Regents. Notes: Reading proficiency is from 2007-08; remediation rates are form high school graduates in 2012 enrolling as first-time college students in fall 2012.
As it turns out, standardized test results matter, to a certain degree, as an indicator of future educational outcomes. A district’s eighth-grade proficiency rate is correlated to that cohort’s high-school graduation rate. Similarly, eighth-grade proficiency is also related to the cohort’s remediation rate, though to a lesser degree than graduation rates. True, the correlations are by no means perfect, but this lack of strong connection indicates that Ohio’s current assessments are not accurately assessing college readiness. It’s likely that Ohio’s impending transition to more-rigorous state standards and aligned state assessments will strengthen the link between test proficiency and “remediation-free” status for college freshman, and it’s high time we increase the level of rigor in our schools.
[1] The actual cohort for any particular district may not be the same, as potentially high mobility rates between districts are not accounted for, nor are dropout rates or grade retentions.
[2] An R-squared value of 1.0 indicates that the input variable explains all of the variability of the response variable. An R-squared of 0.0 indicates that no variation is explained.
[3] The correlation coefficient for eighth-grade reading proficiency and subsequent graduation rate is 0.630. Similarly, the correlation coefficient for eighth-grade math proficiency and graduation rate is 0.602. A coefficient of +1.0 indicates a perfect positive relationship; -1.0 indicates a perfect negative relationship; 0 indicates no relationship between two variables.
[4] The correlation coefficients for eighth-grade reading and math proficiency and participation in developmental English or math are 0.547 and 0.465 respectively. A coefficient of +1.0 indicates a perfect positive relationship; -1.0 indicates a perfect negative relationship; 0 indicates no relationship between two variables.
