Through its science of reading initiative, Ohio is devoting significant resources to strengthening literacy across the state. Boosting reading proficiency is essential, and this ambitious effort holds great promise to do just that.
Through its science of reading initiative, Ohio is devoting significant resources to strengthening literacy across the state. Boosting reading proficiency is essential, and this ambitious effort holds great promise to do just that. Yet instruction in other subjects—including math, most critically—shouldn’t get lost in the shuffle. As a recent study from the Urban Instituteindicates, increased math performance delivers even stronger long-term returns for students—specifically, higher earnings as adults—than improving reading skills. At a more global level, Stanford University’s Eric Hanushek and colleagues have found that national performance in math is highly correlated to countries’ economic prosperity.
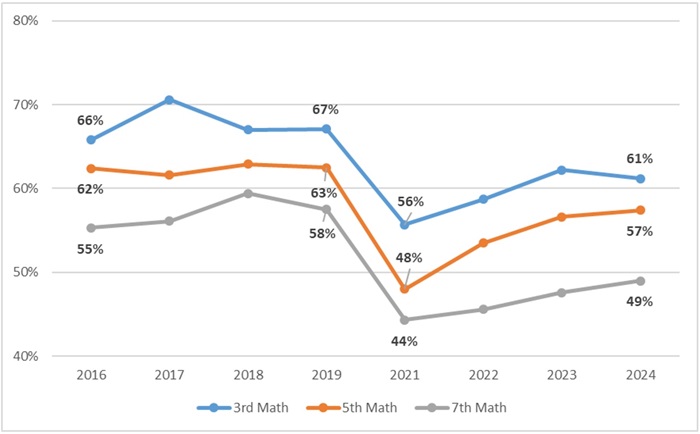
In short, numeracy matters immensely. But math achievement in Ohio and nationally has long been lackluster—and it got much worse during the pandemic. Figure 1 shows the trends in Ohio’s math proficiency rates in grades three, five, and seven. Prior to the pandemic, roughly 55 to 70 percent of students were proficient in math, depending on grade and year. Those rates fell to record lows by 2020–21. They’ve ticked upward since then but still fall significantly behind pre-pandemic levels and remain far below what any state should expect of its students.
Figure 1: Ohio’s math proficiency rates in elementary and middle school grades, 2015–16 to 2023–24
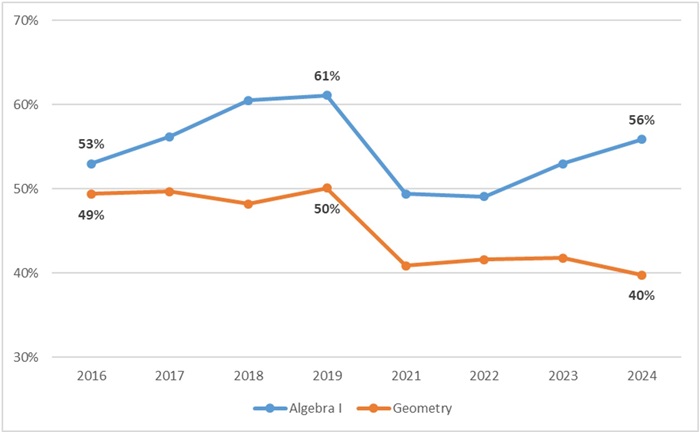
Similar patterns emerge in high school. In Algebra I, we see a sharp decline in proficiency during the pandemic followed by some recovery. But there’s no sign of post-pandemic recovery in geometry. Moreover, while not displayed below, some districts’ math proficiency rates are downright abysmal. In 2023–24, just 18 percent of Columbus City Schools’ students were proficient in Algebra I and 11 percent in geometry. (Fewer than one in five!) In South-Western, the second largest district in Franklin County, just 29 percent reached achieved proficiency in geometry, though a more respectable 56 percent met that mark in Algebra I.
Figure 2: High school proficiency rates in high school Algebra I and geometry, 2015–16 to 2023–24
Just as they did with reading, state policymakers need to step up to boost the math proficiency of young Ohioans. While it may be tempting to copy and paste the state’s literacy efforts, that’s not the best path forward. The challenge, as a trio of math scholars recently noted, is that “there is less available research on math-related interventions and instructional practices than in reading.” With a smaller evidence base, it’s harder to pinpoint specific curricula, practices, and programs that should be encouraged—or even required—as well as ones that should be discontinued.
That said, math experts have put their finger on key elements that ought to guide math instruction. In 2001, the National Research Council (NRC) identified five “strands” of math proficiency, which were later echoed by the National Mathematics Advisory Panel (NMAP) in 2008 and are generally accepted by experts and educators today. One strand is “procedural fluency,” which includes knowing times tables by heart and mastering the standard procedures used to solve problems (e.g., carrying a digit when adding). Another strand is “conceptual understanding,” which is the ability to comprehend math concepts and relationships. For example, the NRC report notes that when students understand that addition is commutative (e.g., 3+5=5+3), they have to memorize half the addition combinations. Though procedural fluency and conceptual understanding are sometimes viewed as competing approaches, both the NRC and NMAP reports emphasize that they are equally essential to proficiency and they complement each other.[1] As for more practical assistance for math teachers, the U.S. Department of Education’s What Works Clearinghouse (WWC) has released several practice guides over the past two decades.[2] Its most recent math-related guide from 2021 offers six strong (“tier 1”) evidence-based recommendations for elementary math instruction.
Translating these concepts—as well as other research-backed ideas—into concrete policy is no easy task. But difficult doesn’t mean impossible, and here are six ideas that Ohio lawmakers should pursue to increase math proficiency.
Require the Ohio Department of Education and Workforce (DEW) to undertake a review of core math curricula. Ohio’s literacy initiative has rightly centered on ensuring schools use high-quality curricula aligned to the science of reading. Those efforts have included reviews of the reading curricula available to Ohio schools and compiling a list of high-quality instructional materials. In similar vein, lawmakers should direct DEW to review the core math curricula (grades K–12) that are currently on the market to assess their alignment with state math standards and the NRC/NMAP concepts, as well as effective practices identified by WWC and other math experts.[3] In its review, the department should take seriously EdReports’ ratings, which award strong marks to well-respected curricula such as Eureka Math and Illustrative Math. This process would yield a list of recommended high-quality math curricula that can help inform schools’ decisions about math curriculum moving forward.
Increase public transparency regarding which math curricula schools are using. Thanks to the state’s recent literacy reforms, we know more about schools’ elementary reading curricula. But we know virtually nothing about math. That should change, as math curricula choices are crucial to the quality of instruction. To provide more sunlight about which math programs are in use, legislators should require all public schools to report to DEW their core math curricula. The agency should in turn disclose schools’ math and reading[4] curricula on schools’ state report card, while also including an indicator about whether they appear on the state’s recommended list.
Ensure prospective elementary school teachers have strong content knowledge by requiring them to pass the math section of their licensure exam. Teachers cannot effectively teach math if they don’t understand it. That’s common sense and also supported byresearch. While Ohio does check middle and high school math teachers’ content knowledge via passage of a math-specific licensure exam, it does not do so for elementary teachers. Instead, teachers applying for the grades PK–5 elementary license take a composite content knowledge exam that includes math, but also sections on literacy, science, social studies, and the arts.[5] To pass the test, prospective teachers are only required to earn an overall passing score. That means a future elementary teacher could fail the math section but still pass the test based on their competency in other subjects. Given the importance of math—and the likelihood that an elementary teacher will be asked to teach math—state lawmakers should require prospective elementary school teachers to pass the math section of the content knowledge exam in addition to earning an overall passing score.
Require early identification and support for children who are struggling in math. Another way to bolster math in elementary schools is to enact a statewide requirement for schools to screen all students in grades K–3 and identify those with significant math deficiencies. Parents of children who are identified as being off track should be notified, and schools should create a math improvement plan for the student. These screening, notification, and plan requirements could mirror Ohio’s current reading requirements in grades K–3. In schools with significant numbers of off-track students in math, the state should provide additional instructional help by providing math coaches (akin to its literacy coaching initiative).
Encourage tutoring that adheres to quality standards for high-dosage tutoring and effective math practices. As has been widely discussed in the context of post-pandemic academic recovery, high-dosage tutoring (HDT) has historically boasted a strong evidence base. Unfortunately, recentstudies suggest that pandemic-era implementation of HDT has been uneven and the results mixed. But when it’s done well, the extra time and support provided by HDT can significantly boost achievement. Ohio should continue to promote tutoring—perhaps via a math-focused HDT grant program[6]—but policymakers must be more insistent that the programs adhere to quality standards for HDT. These include that tutoring be provided in-person, with a consistent tutor, during the school day, in small groups (less than five students), and for at least three times a week for thirty to sixty minutes. HDT in math should also, of course, align with effective math instructional practices.
Promote “double dosing” and advanced math in high school. Another “more time on task” option with a track recordof success is double dosing, especially in Algebra I. In this model, students participate in two periods of daily math instruction, ideally with the same teacher. One period is focused on direct instruction, while the other is dedicated to additional practice and support. Devoting extra time to Algebra I, in particular, may have stronger rationale, as this course remains a crucial gateway to the more advanced math needed for college and technical professions. State policymakers should encourage double dosing in high schools and spotlight schools effectively deploying this approach. They could consider putting money behind it, too, though double dosing is not likely to be as expensive as HDT, which requires additional staff. Finally, state policymakers should strongly encourage—for students who are ready—Algebra I in eighth grade and advanced coursework during high school. To support that goal, state lawmakers should create an automatic course enrollment policy for high-achieving students.
As with literacy, numeracy is crucial to students’ long-term success, as well as the economic growth of the state. Foundational math skills are essential to carrying out all manner of daily tasks, from managing personal finances to measuring the ingredients in a recipe. Meanwhile, more advanced math—and the rigorous and logical thinking it supports—is necessary for success in higher education and many of today’s occupations. There is a lot of work ahead to ensure that all Ohio students achieve math proficiency. Let’s get cracking.
[1] The other three strands are “strategic competence,” “adaptive reasoning,” and “productive disposition.” The Colorado Department of Education has a concise summary of all five components.
[3] NMAP noted the massive length of many math textbooks, often running hundreds to a thousand pages, and that other high-performing countries use much slimmer texts. Curricula usability (for both teachers and students) should likely be considered, as well.
[4] Reading curriculum disclosure on the report card is not currently required under the state’s early literacy initiative.
[5] They must also pass the literacy-specific Foundations of Reading licensure test, along with a pedagogical test.
[6] With support from federal Covid-relief funds, Ohio has implemented a few tutoring initiatives in recent years. Those dollars have expired, and state lawmakers would need to set-aside state funds to support future tutoring initiatives.
The number of industry-recognized credentials (IRCs) being earned by Ohio students is skyrocketing. Attainment tripled between 2018 and 2023, from more than 40,000 credentials earned to over 126,000. More than 19 percent of the class of 2023 earned an IRC, up from 10 percent in the class of 2022. If attainment continues to climb at this pace, more than a fourth of the class of 2024 will graduate with an IRC.
Given that credentials can boost earnings and employment, this should be good news. But not all IRCs are created equal. Some are in demand by employers and lead to well-paying jobs. Others aren’t and don’t. It’s crucial to distinguish between the two.
Unfortunately, Ohio doesn’t currently have a rigorous system for doing so. The state does assign each credential a point value between one and twelve. But point values are determined by a committee based on industry-reported demand, rather than data on workforce outcomes like wages. Employer demand matters, of course, but it shouldn’t be the only measure. And even if point values are meaningful signals of demand, those signals don’t seem to be getting through to students. Nearly 70 percent of the credentials earned by the class of 2023 were worth less than six points.
The upshot? More students are earning credentials than ever before, but according to the state’s point system, most of those credentials aren’t in high demand. Even worse, we have no way of knowing whether the students who earn any credential—whether it’s worth one point or twelve—are better off in the short or long term.
To fix this, Ohio needs to establish a standardized, data-driven framework that identifies the impact of specific credentials on workforce outcomes. State leaders must start by making some policy tweaks to improve data collection and transparency. But they also need to identify measures the state can use to determine a credential’s value.
In October, a nonprofit advocacy and research organization in Tennessee called SCORE published a multi-measure framework designed to help students, policymakers, and stakeholders understand the impact of specific credentials on workforce outcomes. Although the framework was designed for Tennessee, Ohio leaders could learn a thing or two from it. Two of the framework’s measures, in particular, should be on Ohio’s radar going forward. Let’s take a closer look.
1. Annual earnings
This measure determines whether students who obtain a credential are equipped to earn higher wages that meet cost-of-living standards, thereby ensuring they receive a return on investment from their credential. To earn one star on SCORE’s three-star scale, a credential’s median earnings,[1] measured five years after completion, must be at or above the living wage for a single adult in Tennessee ($43,196).[2] To be designated as two or three stars, minimum earnings after five years must be 140 percent ($60,474) and 180 percent ($77,753) of the cost of living, respectively.
This isn’t the only way to measure annual earnings. SCORE notes in its report that Texas determines credential impact by examining whether a credential-holder earns enough within ten years to pay for the cost of their post-secondary education and surpass the earnings of a typical high school graduate. Either of these measures could work in Ohio, provided they’re calculated according to the distinct costs of living and obtaining an education here. State leaders could also establish a unique measure—perhaps one that takes into account cost of living according to Ohio’s seven geographic regions rather than a statewide average.
Regardless of how it’s done, linking credentials to wages would be a step in the right direction. Ohio’s Department of Job and Family Services already offers data search tools that outline wages by occupation and industry. It’s time to include credentials, too. Students deserve to know the wages they can expect before they invest time and effort to earn a credential. School counselors and educators need access to that information so they can provide meaningfulcareer advising. And state leaders need to ensure that state policyfocusesincentives on credentials that lead to better earnings for students.
2. Job outlook
This measure ensures that a credential is aligned to the skills and knowledge required for job opportunities. Between 2020 and 2030, Tennessee’s projected annual job growth rate is 1.6 percent.[3] SCORE used that number to set the threshold for its highest tier. Three stars means that a credential’s aligned job demand will annually grow by the state average from 2020 to 2030. A two-star designation represents aligned job demand growth of 1.2 percent, while a one-star designation represents aligned job demand growth of 0.8 percent.
Ohio officials could make a similar calculation regarding projected annual job demand in the Buckeye State and then link that demand to jobs aligned with each credential. Industry leaders, especially those who are part of the committee that currently determines the point value of a credential, should still be involved. In fact, it might be wise to have two measures for identifying job outlook—one that focuses on short-term demand according to feedback from industry partners and a second that considers long-term job outlook based on projected data.
One of the drawbacks of SCORE’s job outlook measure is that it doesn’t take into consideration regional and local demand. That’s not going to work here, as JobsOhio heavily emphasizes the state’s seven geographic regions. It wouldn’t make sense for the state, which has invested so much in regional data tracking, to limit job outlook measures for credentials to only statewide projections. To solve this problem, leaders should look to Ohio’s school report cards for a solution. Just as the state disaggregates proficiency data by school, subject, and grade level, it could disaggregate job outlook according to state, regional, and local demand.
***
Identifying the value of an industry-recognized credential is tricky work, as there will always be anecdotes arguing for or against each one. But anecdotes shouldn’t drive policy, and there are some measures of quality that are important enough to be non-negotiable. One of those measures is annual earnings. If a credential doesn’t ensure that a student is financially better off for having earned it, then it shouldn’t be considered valuable by the state. Another is job outlook. Data that tracks projected job growth over time and across regions is just as important as feedback from industry partners. Given the rapid rise in credential attainment by high schoolers over the last few years, Ohio leaders need to get serious about identifying IRC value. Linking credentials to measures of annual earnings and job outlook is a great place to start.
[1] Tennessee’s statewide longitudinal data system links earnings to credentials and degrees when students enter the workforce but does not link these earnings to the specific jobs that students obtain.
[2] SCORE notes that the Massachusetts Institute of Technology used data on common living expenses to identify the cost of living in Tennessee.
[3] See here for an overview of employment projections methods.
In 2001, Congress enacted No Child Left Behind (NCLB), the much-discussed statute that, among other things, required states to identify their lowest-performing schools and help them improve. In 2015, in an effort to address perceived problems with NCLB, lawmakers revised the law into its current form, the Every Student Succeeds Act (ESSA). Although ESSA introduced new requirements for how states must evaluate school performance and identify low performers, it allowed states far more flexibility than NCLB. Among the changes was a shift in terminology, with schools most in need of intensive support now labeled Comprehensive Support and Improvement (CSI) schools.
In a new report, researchers at the federal Institute of Education Sciences examine whether ESSA played out as policymakers expected. They consider the number, types, and composition of schools that states identified as low-performing just before (2016–17) and just after (2018–19) ESSA’s full implementation. At the most basic level, ESSA reduced the overall number of schools identified as low-performing, from 6,917 during the last year of NCLB to 5,838 in the first year of ESSA—a 16 percent drop. This reduction, they find, was driven mainly by seven states that, before the ESSA switchover, were still operating under the full accountability and school-identification rules of NCLB. In those states alone, the number of identified schools dropped 77 percent, from 4,033 to 930 schools. Most other states had previously sought and been granted waivers from various aspects of NCLB, which allowed them flexibilities akin to those included in ESSA. Waiver states saw a 70 percent increase in the number of schools identified as low-performing when they switched to ESSA rules.
The types of schools identified as low-performing broadened across the board, resulting in more small schools and charter schools appearing on state lists, along with more schools that employ “alternative learning models.” The authors believe this shows ESSA’s school evaluation methodology was applied similarly to all public schools regardless of differences in model, size, or governance structure, but also represents an unintended consequence of the law. Schools that checked all three of those boxes (such as dropout recovery charter schools) were identified under the new law largely because of their high dropout rates, even though they were designed specifically to deal with that population.
Finally, the analysts found that, despite ESSA’s expanded list of accountability measures and increased flexibility, states still tended to identify schools with the lowest test scores. The only real difference was that fewer schools were identified overall, and those that ended up in CSI status were less likely to have high concentrations of historically underserved students. This is likely due to greater use of performance measures instead of (or in addition to) proficiency, like student growth rates, which are less correlated with poverty.
The report warns of too many supports potentially going to small alternative schools that don’t need them as badly as others, potentially diluting the available resources. Overall, though, it seems that the ESSA changes worked out as intended, correcting the perceived shortcomings of NCLB identification rules. However, none of this has anything relation to how either NCLB or ESSA have impacted schools and students on the ground. Luckily, some other analysts have begun to dig into that question, mindful that the identification of schools is only the first step in a much more detailed—and important—process of school improvement.
Early-college high schools are those that fully incorporate college course-taking into the curriculum. They are not to be confused with a more-typical “dual enrollment” model, which allows students the opportunity to take college courses if they have time. Early college schools bake in college attendance (and almost always in person in university lecture halls and science labs) as part of the four-year high school experience. In general, they do this by accelerating traditional high school coursework to allow students as much time as possible to attend postsecondary classes—and hopefully earn transferrable credits—before graduation. The model is new enough to still be the subject of pilot-program-style research but old enough to have a significant amount of longitudinal data informing that research. A new report from the American Educational Research Association journal, examining the early-college model’s impact on college degree attainment, illustrates the point.
This report is the second follow-up on students who first entered high school almost twenty years ago. My colleague Aaron Churchill reviewed the first published research in 2013, and some of the same analysts led this successor study. The sample for the original early-college impact study consisted of students who participated in admission lotteries offered by a set of ten early-college schools in five states (North Carolina, South Carolina, Texas, Utah, and Ohio) and who entered ninth grade between 2005 and 2007. Treatment group students were those who applied for a school’s ninth-grade lottery and were offered a spot in one of the schools (n= 1,028); control group students were those who applied but were not offered a spot (n=1,360).
The original study, using an intent-to-treat model, was published in 2013 and found higher rates of high school graduation—and college enrollment within two years of graduation—among students admitted to an early-college school. The first follow-up study, using the same methodology and published in 2021, found that early-college admittees had significantly higher rates of associate degree completion (29.3 percent vs. 11.1 percent) and bachelor’s degree attainment (30.1 percent vs. 24.9 percent) than their non-admitted peers within six years of expected high school graduation.
And now the newest study follows up again with the same students ten years after graduation. It uses the same methodology as before but excludes fifty-seven of the original subjects due to a change in data access from one state’s department of education. The impact of early college school admittance on postsecondary degree completion was still statistically significant over the longer term, though it was greatly decreased. Treatment group students were 8.5 percentage points more likely to have earned a postsecondary degree by year ten than control group students. The results for associate degree completion were roughly similar to the overall results. The impacts of early-college admission on bachelor’s degree completion, however, were no longer significantly different between the two groups after year four. For master’s degree completion, the statistical difference ended after year six. Impacts on Black and Hispanic students in the treatment group were higher across the board than for their White and Asian counterparts. Interestingly, the strongest impacts on associate degree completion were among the highest-achieving middle school students (as determined by eighth grade test scores), indicating that the most-prepared students in early-college schools were able to fully or nearly complete their associate degrees before leaving high school. The bottom line: Early-college students attained degrees at a higher rate and faster pace than control students for nearly a decade after graduation.
This would appear to be the end of the road for this particular line of research regarding degree attainment, although it might be instructive to try and replicate the effort with more-recent cohorts of students. In the nearly two decades since the students in this study entered high school, the early college movement has expanded to more schools, new models, and other states. It’s time to move the impact research on to those new pastures. However, there is likely still data to be mined from these original subjects in terms of career pathways and earnings trajectories.
Since taking office in 2019, Governor DeWine has prioritized expandingand improvingcareerpathways. One of the benefits of a well-designed pathway is the opportunity for students to earn industry-recognized credentials (IRCs). Credentials allow students to demonstrate their knowledge and skill mastery, verify their qualifications and competence via a third-party, and signal to employers that they are well-prepared. IRCs may be prerequisites for certain jobs and can also boost earnings and employment.
Although Ohio has some roomto grow when it comes to data collection and transparency, it does annually track IRCs at the state and district level. In this piece, we’ll examine a few takeaways from the most recent state report card.
1. The number of credentials earned by Ohio students is skyrocketing.
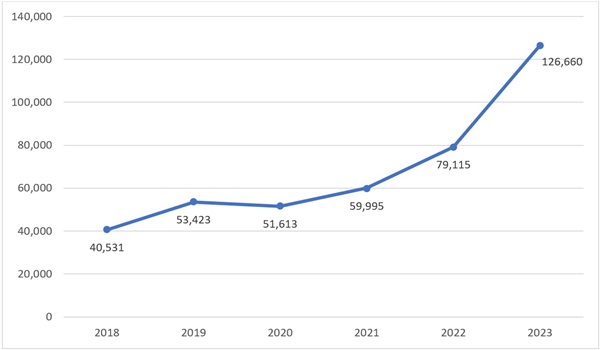
Over the last few years, the number of credentials earned has dramatically increased. Chart 1 demonstrates that between 2018 and 2023 the number tripled. The two most recent years, 2022 and 2023, represent a particularly steep incline.
Chart 1. Number of credentials earned statewide, 2018–2023
This credentialing surge can be attributed to several factors. First, state-funded initiatives like the Innovative Workforce Incentive Program—which was designed to increase the number of students who earn qualifying credentials in “priority” industry sectors—are likely having an impact. Second, Ohio lawmakers passed a revised set of graduation requirements in 2019 that made room for career pathways. Under these standards, students must not only complete course requirements to earn a diploma, but also demonstrate both competencyand readiness. For the competency portion, they are permitted to meet standards based on career experience and technical skill, which can include earning at least twelve points in the state’s credentialing system (more on that below). For the readiness portion, students must earn at least two diploma seals. The Industry-Recognized Credential Seal is one of those options.
2. It’s unclear whether the most-earned credentials are valuable to students.
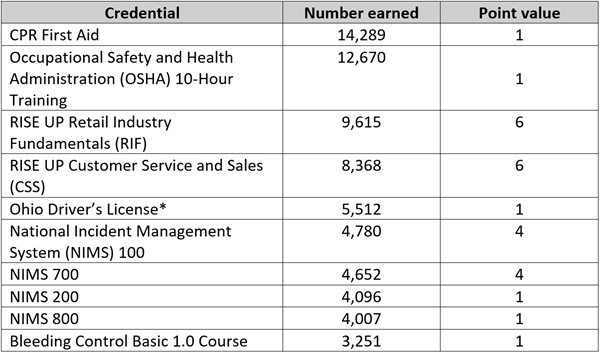
There are several ways to determine the value of a credential. One is by considering whether the state has identified it as valuable. In Ohio, credentials are assigned a point value between one and twelve. Point values are based on employer demand and/or state regulations and often signal the significance of the credential. For example, within the health career field, credentials like CPR First Aidor respiratory protection are each worth one point. In that same career field, a Certified Pharmacy Technician is worth twelve points. Unfortunately, as demonstrated by Table 1, none of top ten credentials earned by students in Ohio are worth twelve points. Half are worth just one point.
Table 1. Top ten credentials earned statewide 2023
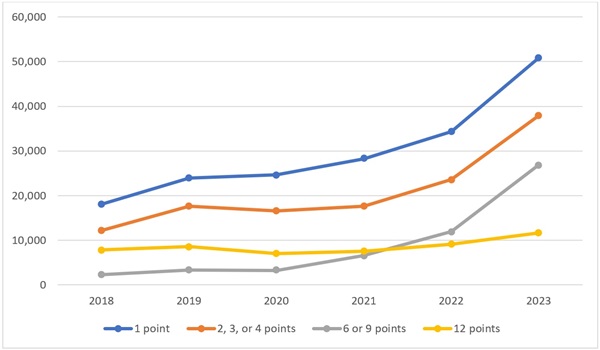
The prevalence of one-point credentials isn’t a recent development. Chart 2 demonstrates that credentials worth one point have consistently been the most earned since 2018. Over the last six years, the number of twelve-point IRCs being earned hasn’t increased as rapidly as the number of one-point IRCs earned. And the gap between the two has grown each year. In 2018, the gap between one-point and twelve-point credentials was just over 10,000. By 2023, it had grown to more than 39,000.
Chart 2. Credentials earned statewide according to point value, 2018–2023
Another way to determine value is by examining employer demand. If employers are eager to hire graduates who possess a certain credential, then that credential is more valuable. But determining demand can be difficult, as employers often don’t signal which credentials are necessary for a job position, which are just “nice to have,” and which are irrelevant. A 2022 analysis of IRCs conducted by ExcelinEd and Lightcast attempted to offer some insight on employer demand by examining the average annual number of Ohio job postings that requested credentials over a two-year period (2020 and 2021). It’s by no means a perfect measure—it’s possible that employers value certain credentials even if they don’t mention them in job postings, and that some IRCs give students an unseen boost over other applicants. But until Ohio has better data, job postings are the easiest way to uniformly assess employer demand across the state.
Table 2 below identifies the top ten credentials statewide and how many were earned in 2023. Column three identifies the average annual number of Ohio job postings that requested each credential. Column four calculates the difference between recent supply (the number of credentials earned by the class of 2023) and previous employer demand. Red shading indicates that a credential is oversupplied, while green shading indicates an undersupply. With one exception—a state-issued driver’s license—all of Ohio’s most frequently earned credentials were not in high demand by employers. That should concern us.
Table 2. Annual demand for top ten credentials earned statewide
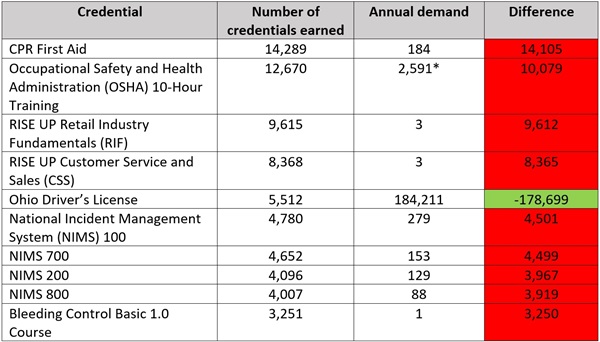
A third way to consider value is through wages and salaries. Unfortunately, as is the case with employer demand, wages and salaries can be difficult to pin down. The aforementioned IRC report offers some insight. For example, although National Incident Management System (NIMS) credentials don’t have much annual demand, the postings that do request them have advertised wages above $50,000. But other credentials in Ohio’s top ten list—like CPR First Aid, OSHA 10-Hour, and RISE UP Retail Industry Fundamentals—don’t have advertised wages identified by the report. In other words, we don’t know for sure that students who earn these credentials end up in well-paying jobs. Going forward, it will be crucial for state leaders to follow through on linking education and credentials with workforce outcomes like wages.
3. Some districts are posting higher credential numbers than others.
In 2023, the five districts with the highest number of IRCs were Columbus, Cincinnati, Akron, Dayton, and Cleveland. All five of these districts are in the Ohio Eight. Together, they account for nearly 9 percent of Ohio’s students and roughly 12 percent of the credentials earned statewide. Table 3 identifies credential earning numbers from the last six years for each district as well as the state.
Table 3. Number of credentials earned in selected districts, 2018-2023
Given that it’s the largest district in the state, it’s not surprising that Columbus posted the highest number. In fact, in 2023, the district made up nearly 5 percent of all credentials earned statewide. But there have been some pretty significant increases elsewhere, too. Akron, for instance, went from 100 credentials earned in 2018 to more than 1,200 the following year. Other districts, like Cincinnati, Dayton, and Cleveland, didn’t see sharp increases until 2022 or 2023.
These rapidly rising numbers raise some important questions. For example, what credentials did students start earning in Akron to account for such massive growth? Are Columbus students earning the same credentials in 2023 that they were in 2018? To find out, we compiled some additional tables that can be found here. They identify the top three credentials earned in each district between 2018 and 2023. The number of IRCs earned appears in parentheses. There are a few interesting data points to note.
First, Akron’s sudden surge is attributable to RISE UP credentials. Since 2019, students in the district have earned 2,529 Retail Industry Fundamentals credentials and 1,739 Customer Service and Sales credentials. Each of these IRCs is worth six points and can be earned in the same career field (business, marketing, and financeor hospitality and tourism), which means students can bundle them to earn a diploma. And yet, according to job posting data, neither credential is in demand by employers. Remember, it’s still possible that employers in the Akron area value these credentials. But we don’t know for sure. In a similar vein, we have no idea whether these credentials lead to well-paying jobs with advancement opportunities. Until Ohio directly links workforce outcome data to credentials, there’s no way to know whether Akron students who earned these IRCs are better off.
Second, Cleveland’s sudden increase between 2022 and 2023 is also attributable to RISE UP credentials. The district’s top credential during 2022 was Microsoft Office Specialist PowerPoint 2016, with twenty-one credentials earned. The following year, the top credential was Retail Industry Fundamentals (223 earned), followed closely by Customer Service and Sales (217 earned).
Third, in the last two years, an increasing number of Columbus students are earning credentials from the National Incident Management System. These IRCs account for the district’s top four credentials in 2023, adding up to a total of 2,913. That’s approximately 46 percent of the district’s 2023 total. Columbus isn’t the only district that’s championing these credentials, either. Cincinnati and Cleveland also had National Incident Management System credentials in their top three during 2022 and 2023.
***
Over the last few years, Ohio policymakers have prioritized improving career pathways. Expanding opportunities to earn an IRC has been a key part of those efforts. The good news is that more students than ever are earning credentials. The bad news is that it’s unclear whether the students who are earning those credentials are better off. Going forward, Ohio leaders must carefully consider how to ensure that students—and schools—are incentivized to focus on meaningful credentials that lead to well-paying jobs.