Mobile Navigation

  • National
    • Policy
      • High Expectations
      • Quality Choices
      • Personalized Pathways
    • Research
    • Commentary
      • Gadfly Newsletter
      • Flypaper Blog
    • Events
    • Scholars Program
  • Ohio
    • Policy
      • Priorities
      • Media & Testimony
    • Research
    • Commentary
      • Ohio Education Gadfly Biweekly
      • Ohio Gadfly Daily
  • Charter Authorizing
    • Application
    • Sponsored Schools
    • Resources
  • About
    • Mission
    • Board
    • Staff
    • Career
Home
Home
Advancing Educational Excellence

Main Navigation

  • National
  • Ohio
  • Charter Authorizing
  • About

Ohio Menu

  • Topics
    • Accountability & Testing
    • Advanced Education
    • Career & Technical Education
    • Charter Schools
    • Curriculum & Instruction
    • ESSA
    • Evidence-Based Learning
    • Governance
    • Personalized Learning
    • Private School Choice
    • School Finance
    • Standards
    • Teachers & School Leaders
  • Research
  • Policy
  • Commentary
    • Ohio Gadfly Newsletter
    • Ohio Gadfly Blog
    • Events

The Education Gadfly Weekly

Sign Up to Receive Fordham Updates

We'll send you quality research, commentary, analysis, and news on the education issues you care about.
Thank you for signing up!
Please check your email to confirm the subscription.

Ohio Gadfly—Resources that can help Ohio families make school choice decisions

Volume 19, Number 3
2.3.2025
2.3.2025

Ohio Gadfly—Resources that can help Ohio families make school choice decisions

Volume 19, Number 3
view
Private school choice parent info blog image
School Choice

Three resources that can help Ohio families make school choice decisions

Despite what you may hear in the media, Ohio collects and publishes plenty of important data on the private schools that accept state scholarships. Here are just a few of the worthwhile resources parents should know about.

Jessica Poiner 2.3.2025
OhioOhio Gadfly Daily

Three resources that can help Ohio families make school choice decisions

Jessica Poiner
2.3.2025
Ohio Gadfly Daily

Ohio should automatically enroll high-achievers in eighth grade algebra

Aaron Churchill
1.31.2025
Ohio Gadfly Daily

Two ways state leaders could lead the charge on chronic absenteeism

Jessica Poiner
2.4.2025
Ohio Gadfly Daily

Findings on homeschool persistence can help researchers going forward

Jeff Murray
2.4.2025
Ohio Gadfly Daily

Outcomes of a virtual literacy tutoring intervention in Massachusetts

Jeff Murray
1.30.2025
Flypaper

Fordham Institute media statement on Governor DeWine's budget

Ohio Education Gadfly
2.3.2025
Ohio Gadfly Daily

Fordham Institute media statement on 2024 Ohio NAEP scores

Ohio Education Gadfly
1.29.2025
Ohio Gadfly Daily
view
Algebra problems on paper

Ohio should automatically enroll high-achievers in eighth grade algebra

Aaron Churchill 1.31.2025
Ohio Gadfly Daily
view
Chronic absenteeism blog image

Two ways state leaders could lead the charge on chronic absenteeism

Jessica Poiner 2.4.2025
Ohio Gadfly Daily
view
Homeschooling persistence SR image

Findings on homeschool persistence can help researchers going forward

Jeff Murray 2.4.2025
Ohio Gadfly Daily
view
Student using a computer at home

Outcomes of a virtual literacy tutoring intervention in Massachusetts

Jeff Murray 1.30.2025
Flypaper
view
Media alerts stock image

Fordham Institute media statement on Governor DeWine's budget

Ohio Education Gadfly 2.3.2025
Ohio Gadfly Daily
view
Media alerts stock image

Fordham Institute media statement on 2024 Ohio NAEP scores

Ohio Education Gadfly 1.29.2025
Ohio Gadfly Daily
view
Private school choice parent info blog image

Three resources that can help Ohio families make school choice decisions

Jessica Poiner
2.3.2025
Ohio Gadfly Daily

Ohio is home to five private school scholarship programs. The Jon Peterson Special Needs and Autism Scholarship programs are exclusively available for students with special needs. The Cleveland Scholarship is for students who reside in the Cleveland Metropolitan School District. And the remaining two programs, which are collectively known as EdChoice, have much broader eligibility criteria. Together, they offer scholarships to every student in Ohio.  

For many Ohioans, these programs are a lifeline. They empower parents to make schooling choices based on what’s best for their children rather than where they can afford to live. They provide an escape hatch for those assigned to a persistently low-performing neighborhood school, or a high-performing one that just isn’t the right fit. Even for families that ultimately end up choosing a district school—and the vast majority do—having options matters.

To truly consider their options, however, families need access to high quality school data. For district and charter schools, state report cards are a handy tool that fulfill that need. But Ohio doesn’t currently have a similar resource for private schools. Many offer information on their websites, but meaningful comparison to other schools can be difficult and time-consuming. Even when parents have the time and energy to spare (which is no small feat), it can be hard to sort through fact and fiction because choice opponents routinely flood the media with misleading claims and inaccurate analyses.

It’s not all doom and gloom, though. Ohio collects and publishes plenty of crucial data on the private schools that accept state scholarships. Not all of this information is useful to families. It’s hard to imagine, for example, that a family debating between a district, charter, and private high school for their rising ninth grader cares much about administrative cost reimbursements. But there are a few resources that are worthwhile. Let’s take a look at three.

1. Detailed lists of private schools that accept state scholarships

The first important piece of information that school-searching families need is an answer to the question: What’s available near me? To help families discover their options, Ohio provides two interactive tools.

The first is a scholarship dashboard that allows parents to search for options based on the scholarship programs they’re eligible for. The parents of a rising Kindergartener with autism, for example, could select the Autism Scholarship from the dropdown menu and receive a list of every provider in the state that accepts that particular scholarship. Clicking the “proceed” button for a specific provider offers more detailed information, including its physical address, a link to its website, and information about staff (such as certifications and licensure) and offered services (like occupational therapy or speech and language services).

The second is an interactive directory that offers information about every state-approved scholarship provider in Ohio. Parents can filter results by program, county, city, site type, and grade level. The directory also provides an interactive map that allows users to navigate all the way down to the street level, which could be immensely helpful for families with transportation concerns.

2. Test results

Once families are aware of what’s available, academics are often the next big question. In Ohio, students who attend private schools on state-funded scholarships are required by law to take a state-approved assessment in certain grades and subject areas.[1] That includes math and English language arts in grades 3–8, science in grades 5 and 8, and five high school end of course exams. In private schools where 65 percent or more of a school’s total enrollment is scholarship students, the entire student body—not just those enrolled on a scholarship—must take these state-required tests.

The Department of Education and Workforce (DEW) is required to compile and disaggregate results and then post them on its website. To fulfill this requirement, DEW annually updates a scholarship assessment report. This report discloses proficiency rates for scholarship students at the state level, as well as at individual private schools and by students’ home districts. Results can be filtered by school year, type of scholarship, grade band, and student subgroup. The data, however, are not reported in a user-friendly format. Because they are tucked away in hard-to-find databases on the DEW website, it’s hard to believe that many parents have ever looked at these numbers, much less used them to inform their decision-making.

Proficiency rates are important, but they’re not the only academic data point that matters. For years, Ohio has calculated a progress measure for public schools that measures the academic growth students make over the course of a year. This data is crucial, as it showcases a school’s contribution to student learning and provides results that are more neutral in regard to demographics. Unfortunately, Ohioans don’t currently have access to a similar measure for private schools that accept state scholarships. But that’s about to change. As part of the 2023 state budget, lawmakers passed a provision requiring DEW to develop a student growth measure for scholarship students in grades 4–8 and to post the results on its website. Once this measure is in place (which will likely be in 2026), families will have a more complete picture of school quality to use when making enrollment decisions.

3. Visit checklist

When most people think of “school visits,” it’s usually in terms of higher education—students travel to the colleges and universities they’re considering, go on tours, meet current students and staff, and ask plenty of questions. But school visits aren’t exclusive to higher education. Students and families can also visit K–12 schools, including private schools that accept state scholarships.

To help families ask the right questions on these visits, DEW offers a parent visit checklist. It’s not particularly detailed, but that’s a good thing—it’s much easier for parents to keep track of a single sheet of paper, and to compare their notes from multiple schools. Moreover, despite its brevity, the checklist succeeds in identifying several really important areas where parents might need more information. That includes admission requirements, discipline policies, religious expectations, costs (not just tuition but also books, supplies, and uniforms), and what the school offers in terms of transportation, tutoring, before/after care, breakfast and lunch, sports, clubs, and field trips. The checklist also identifies documents that parents should be prepared to provide to schools, including birth certificates, proof of address, and academic records from their child’s prior school.

***

Each year, tens of thousands of families in Ohio choose to send their children to private schools using state scholarships. Their reasons for doing so vary. But every family, regardless of why they’re exercising school choice, deserves access to detailed and accurate information about their options. Ohio currently offers some key pieces of information, including interactive lists of schools, state test results, and other helpful resources. But state leaders can and should do more to ensure that families have everything they need to make an informed choice. In a follow-up piece, we’ll explore ways that Ohio can provide more accessible information about private schools.



[1] That test can be, but is not required to be, the state assessment.

view
Algebra problems on paper

Ohio should automatically enroll high-achievers in eighth grade algebra

Aaron Churchill
1.31.2025
Ohio Gadfly Daily

Surprising as it may seem, high-ability students often end up falling short of their potential. Studies based on national data have found that substantial numbers of high-achievers—particularly from disadvantaged backgrounds—lose their edge as they progress through middle and high school. Closer to home, Fordham research discovered that just one-third of Ohio’s high-achieving, low-income students went on to attend four-year colleges.

What can be done to help more high flyers “maintain their altitude”? There are plenty of good ideas out there, and to their credit, Ohio policymakers have already implemented several of them. Such initiatives include whole-grade screenings for gifted identification and a requirement that high school juniors take the ACT or SAT, which ensures students with strong college potential are not skipping these exams. Governor DeWine has successfully pushed for the Governor’s Merit Scholarship, which provides students in the top 5 percent of their school’s graduating class with $5,000 per year for college.

Another promising policy is automatic enrollment in advanced coursework. North Carolina is the pioneer on this front. In 2018, Tar Heel legislators required schools to provide advanced math courses to all students—starting in third grade—who achieve high marks on their previous year’s state math exams. Several other states have followed suit, including Illinois, Texas, and Washington. 

The rationale for auto-enrollment is straightforward. Getting onto an advanced pathway—especially in math—is critical for admission to competitive colleges and for successful STEM careers. But too many young Ohioans are missing out on advanced learning opportunities, despite having strong academic records. The reasons vary. In many schools, placement on advanced tracks is based on teacher recommendations or parental requests, a process that could easily overlook disadvantaged students. Applying for such courses may discourage some students—or just not seem “cool.” Meanwhile, some schools—more likely urban or rural—offer little or no advanced coursework.

Auto-enrollment policies aim to level the playing field. It doesn’t take a special recommendation or pushy parent to advance a student. Instead, demonstrated achievement on a standardized test is what puts students on more rigorous academic pathways. These policies also require schools that haven’t been providing challenging coursework to begin doing so. This combination of equity and merit has led respected education groups—including Education Trust, Excel in Ed, and Stand for Children—to push for auto-enrollment policies for high-performing students.

Ohio hasn’t yet adopted such a policy, but it should. As a starting point, lawmakers should require automatic enrollment in eighth grade Algebra I for high-achieving seventh graders. Taking this course in eighth grade is critical, as it allows for a math sequence during high school that opens doors to both selective colleges and math-focused areas of study. (Conversely, waiting until ninth grade for Algebra I limits students’ ability to take college-prep math as juniors and seniors. They simply run out of time.)

How to craft such a policy? One crucial question is where to set the bar for automatic enrollment. Remember, this isn’t an “algebra for all” policy, a well-intended but flawed idea that sets up ill-prepared students for failure or leads to watered-down algebra courses. Instead, this plan extends automatic enrollment only to seventh graders who demonstrate readiness for eighth grade Algebra I.

Testing data shared by the Ohio Department of Education and Workforce (DEW) offer clear guidance about where to set the bar. Seventh graders who score “accomplished” or “advanced”—the top two achievement levels—on state math exams overwhelmingly succeed if they take Algebra I in eighth grade. In fact, a remarkable 99 percent of seventh graders scoring at the two highest levels went on to achieve proficient or better in Algebra I.[1] Given these numbers, any seventh grader achieving accomplished or advanced on their state math test should be automatically enrolled in eighth grade Algebra I. No further questions asked.

DEW data also show that almost half of today’s seventh graders who reach the accomplished level (or higher) on state math tests do not take eighth grade Algebra I despite their demonstrated ability to succeed in that course. These students—Ohio has roughly 10,000 of them—are the ones who would benefit from an automatic enrollment policy. Instead of getting stuck in regular eighth grade math, they’d get bumped to Algebra I.

Policymakers should also attend to several details that would help make this policy change work well. First, they should include a parental opt-out provision. If parents don’t believe their child is ready for eighth grade algebra, they should be allowed to seek placement in a regular math course. Second, to help schools that will need to implement a new algebra course in eighth grade, DEW should be ready to provide guidance and share best practices on how to do this. Third, policymakers should consider how to beef up middle school math teachers’ capacity to teach Algebra I. They might also set aside some funds for professional development, especially to support middle schools where Algebra I has not been regularly offered.

Too often, eighth graders who have demonstrated readiness for Algebra I find themselves on the outside looking in. That needs to change. Seventh graders who have worked hard and demonstrated their ability to succeed have earned their spot in that class. Let’s make sure they actually get it.


[1] Eighty-six percent scored accomplished or advanced in eighth grade Algebra I.

view
Chronic absenteeism blog image

Two ways state leaders could lead the charge on chronic absenteeism

Jessica Poiner
2.4.2025
Ohio Gadfly Daily

In late January, the U.S. Department of Education published scores from the 2024 administration of the National Assessment of Educational Progress (NAEP), commonly referred to as the “Nation’s Report Card.” As my colleague Aaron Churchill noted, Ohio’s results are a huge disappointment. Reading proficiency rates declined in both fourth and eighth grade, with just 32 percent of fourth graders achieving that benchmark in 2024. The picture is a little rosier in math, where fourth and eighth grade proficiency rates each rose 3 percentage points. And overall, Ohio performed slightly better than the national average. But when more than half of the state’s students are failing to reach NAEP’s ambitious-but-attainable proficiency standard, there’s clearly work to be done.

Coverage of these results has understandably homed in on the pandemic as the primary culprit for low scores (though there are certainly several other factors at play, too). Suggestions for improvement abound. But in many places, the strategies proposed by wonks and advocates are already being implemented. Ohio’s science of reading initiative is a great example. In June 2023, lawmakers established a statewide literacy effort centered on high-quality curricula and materials, teacher professional development, and reading coaches. These evidence-backed policies weren’t in place long enough to impact 2024 NAEP results. But as Mississippi continues to prove, rigorous implementation could have a big impact on Ohio’s scores down the line.

Another widely-cited strategy for improvement is boosting attendance. Here, Ohio has less to be proud of. Over the last few years, state leaders have tried to tackle sky-high absenteeism rates by establishing a taskforce, making pledges, and publishing guidance. But Ohio hasn’t yet seen an intensive, state-backed effort to boost attendance akin to that for early literacy. Maybe that’s why a whopping 25 percent of Ohio students missed at least 10 percent of instructional time during the 2023–24 school year, nearly as bad as the dreadful numbers from the year prior.

With disappointing NAEP scores fresh on their minds, Ohio policymakers might want to consider doing more in the chronic absenteeism arena. A state-led initiative to boost attendance could have a significant impact—not just on national tests, but also state results and overall school performance.

What to do? One option is to invest in improved data collection and transparency. In Rhode Island, policymakers have created several interactive tools that empower school and local leaders, as well as parents and family members, to keep a close eye on student attendance. The Ocean State’s real-time attendance dashboards show daily, weekly, and monthly attendance trends in individual schools, along with data on tardies and students who leave early (both of which can have a sneakily big impact on chronic absenteeism). The daily chronic absenteeism update allows users to track the percentage of students, by district and grade span, who are already chronically absent, as well as how many of those students reached that threshold during the previous school year. And the chronic absenteeism and achievement dashboard underscores the importance of attendance by tracking its impact on state assessments. If Ohio leaders are ready to tackle chronic absenteeism, creating our own version of these dashboards would be a great place to start.

Another option is to invest in an innovative effort like the home-visit program that Connecticut leaders established using federal Covid-relief funding. The Learner Engagement and Attendance Program (LEAP) launched in April 2021 to address student absenteeism and disengagement. As part of the program, fifteen high-need districts were provided with funding to pay for school staff and community organizers to visit nearly 8,700 chronically absent students. Advocates believed that connecting directly with families in this way could help increase the likelihood of regular attendance. And data indicate they were right. Evaluations of the program conducted by the Center for Connecticut Education Research Collaboration found that nine months after the first visit, PK–5 students had an attendance boost of roughly 8 percentage points, while students in grades 6–12 experienced an increase of approximately 16 percentage points.

It’s much too late for Ohio to use Covid-relief funding to establish a similar program. But the potential price tag shouldn’t give lawmakers too much pause. Connecticut designated just $10.68 million in recovery funds to support the fifteen districts selected to participate in LEAP. Given how high chronic absenteeism rates are in certain Ohio districts—some above 50 percent!—setting aside $10 million to target their students with a proven program would be a wise investment.

Rhode Island and Connecticut aren’t the only states grappling with chronic absenteeism in innovative ways. But they offer two simple, relatively inexpensive options for Ohio leaders interested in doing more. There is no silver bullet for boosting student achievement on measures like NAEP. But focusing on the basics—like ensuring that kids are in school when they should be—is a pretty solid place to start.

view
Homeschooling persistence SR image

Findings on homeschool persistence can help researchers going forward

Jeff Murray
2.4.2025
Ohio Gadfly Daily

Conducting empirical research on homeschooling is complicated by two factors. One is the overall lack of longitudinal data on the topic—especially data not reported by survey or other voluntary means. The other is lack of clarity as to what precisely constitutes “homeschooling” in the first place, especially as educational options have broadened in recent years (virtual schools, micro-schooling, ESAs, etc.). A new report from the Journal of School Choice clearly illustrates the issues homeschooling researchers face and offers a couple of insights for further work.

Researcher Albert Cheng of the University of Arkansas uses five nationally representative data sets to construct a picture of the information available on homeschooling. Three of these focus on school-aged children in the U.S. who were being homeschooled at the time their families were surveyed for the National Household Education Surveys Program (NHES) in 2012, 2016, and 2019. The other two focus on U.S. adults who report ever having been homeschooled. Importantly, the adult surveys include full education histories for the respondents, which allows Cheng to identify times when they were most likely not being homeschooled (i.e., formally attending a public or private school). The observable patterns of students moving into and out of homeschooling prove interesting and important.

First up, findings from the Understanding America Study (UAS), conducted between February 2016 and October 2022 by the University of Southern California’s Center for Economic and Social Research. Among those who reported ever having been homeschooled, the majority either did so for only one to two years total (43 percent), or else for all of their primary and secondary education careers (11 percent). The remainder ranged between three and nine years of homeschooling. Very few adults reported being homeschooled for 10 or 11 years. Adults who were homeschooled for only one year spent about 10 years in traditional public schools. Adults who were homeschooled for two or three years were enrolled in traditional public schools for about eight years. Meanwhile, adults who were homeschooled for four or five years spent nearly an equal amount of time in traditional public schools. Private school attendance was low across the board for UAS homeschoolers, but peaked for students reporting six (2.4 years), four (1.9 years), and seven (1.5 years) years of homeschooling. Interestingly, some of those mid-range homeschoolers also reported from one-half to nearly a full year spent not attending school at all during their K-12 careers.

Next, findings from the 2023 Education Survey fielded by Cardus, a Canada-based research entity. Their most recent U.S. survey sought to “examine the school-sector effect in the lives of a nationally representative sample of high school graduates, aged 24 to 39.” The results are remarkably similar to those of UAS: Thirty-six percent of respondents who were ever homeschooled did so for just one or two years while 17 percent did so for all of their primary and secondary education. The mid-range homeschooling durations were also similar, as were the splits between non-homeschooling time spent in traditional public (a lot) versus private schools (a little).

According to both UAS and Cardus, the grade levels at which students moved into and out of homeschooling were all over the map. For example, nearly one-third of adults who were homeschooled in eighth grade exited homeschooling for ninth grade, which could make some intuitive sense given the greater complexity of high school-level curricula and/or the numerous requirements for adequate college preparation. At the same time, though, 64 percent of ever-homeschooled adults were enrolled in formal schools in eighth grade and only about six percent of them moved to homeschooling for ninth grade. Such dichotomies exist at other grade levels, too, indicating what is likely a wide variety of motivations (unobservable in the data at this level) for families choosing to start or end homeschooling at any given time. The main point is that the choice to homeschool seems to be under evaluation at all times among this population.

Finally, Cheng uses the (admittedly incomplete) data from three administrations of NHES as a sort of robustness check on the other survey results, and finds broad congruence. For example, one out of every five NHES children who were being homeschooled at the time of data collection in 2012 had been homeschooled for less than 20 percent of their years of schooling, while 36 percent of those children reported being homeschooled for all of the educational career they had completed at the time of the survey.

These findings, confounding as they may seem, actually provide interesting food for thought for future research on homeschooling. For instance, only a small percentage of students likely fit the definition of “homeschooled” if that is limited to students who never attended a formal public or private school. Indeed, the findings generally reject easy dichotomous comparison between “homeschooled” and “non-homeschooled” students, given the amount of movement between sectors that’s evident in these data. There is a whole continuum of students—probably the majority of those who would cop to the “homeschooled” label—who have actually experienced varying amounts of each type of education. It’s likely that even more students could opt for the “homeschooled” label in the wake of pandemic innovations and post-pandemic school choice expansion. And since those options muddy the definition of “homeschooling” further, future analysts must hone their meanings and refine their comparisons according to the truer picture of what homeschooling is and isn’t, even before they start examining their data.

SOURCE: Albert Cheng, “The Year-By-Year Primary and Secondary Education Histories of Homeschooled Individuals and the Implications for Empirical Homeschooling Research,” Journal of School Choice (December 2024).

view
Student using a computer at home

Outcomes of a virtual literacy tutoring intervention in Massachusetts

Jeff Murray
1.30.2025
Flypaper

Ignite Reading is one of many tutoring interventions unleashed upon America’s schools to try to mitigate learning loss experienced by students in the wake of pandemic-era school closures. The program is advertised as a one-to-one virtual tutoring service that leverages science-of-reading principles as well as individually-targeted, data-driven instruction to help boost the literacy development of young readers. The Center for Research and Reform in Education at Johns Hopkins University conducted a comprehensive mixed-methods evaluation to assess Ignite Reading’s impact on student outcomes and its integration into districts’ instructional frameworks in Massachusetts. Their report was released in December.

Funding for the Ignite Reading intervention came from Boston’s One8 Foundation, which offered grants to districts wishing to access tutoring resources for the 2023–24 school year. In order to apply, districts had to be using a science of reading-aligned ELA curriculum, have provided appropriate professional development to all K–2 teachers, had to commit to literacy screenings for first graders, and had to identify a single staff member to be responsible for all aspects of the rollout. Grants were awarded based on the projected number of first graders with foundational reading needs (up to 300 individuals per district), and participating districts committed to maintaining an average tutoring attendance rate of at least 75 percent of eligible students.

A total of thirteen public school districts across the state received awards, each serving high-concentrations of students living in poverty. Researchers Amanda Neitzel and Joseph Reilly examined the program’s impact on 1,872 first-grade students who received tutoring in those districts, comparing their outcomes on the Dynamic Indicators of Basic Early Literacy Skills (DIBELS) assessment to national norms, as well as a comparison group of 518 first graders who did not receive tutoring but were similar in all other respects. Tests were administered at the start of the school year before tutoring began, and again at the end of the year, once tutoring was completed.

The majority of students receiving tutoring were Hispanic (45 percent) or White (39 percent), with 40 percent classified as English learners and 14 percent receiving special education services. The vast majority of students (74 percent) exhibited kindergarten-level skills in start-of-year testing; the rest were mainly at a first-grade level, with a tiny fraction at second grade.

Tutored students showed significant gains in literacy outcomes, with an average improvement of 5.4 additional months of learning. The expected test score gain from start-of-year to end-of-year based on national norms was 80 points, but the tutoring group registered a much larger gain of 127.89 points. All subgroups of students experienced substantial growth, with only small differences between them. Additionally, far more students exhibited first-grade-level skills (64 percent) or second-grade-level skills (28 percent) on the end-of-year test, a huge improvement over the start-of-year data.

In the other comparison, against the non-treatment students in Massachusetts, the tutoring group also showed significantly higher literacy gains, with an effect size of 0.21 standard deviations. Interestingly however, the proportion of students exhibiting kindergarten-, first-grade- and second-grade-level skills at pre- and post-test were not significantly different between the two groups, although the reason for this is unclear.

The report also includes ample qualitative data gathered via surveys administered to participating educators, literacy specialists, principals, and district leaders. Among other findings, teachers were impressed with the ability of Ignite Reading to serve many students efficiently and reported seeing improvement in their students’ abilities, despite some lingering issues over technology access and reliability.

While it would be interesting to know what non-Ignite supports the comparison students in Massachusetts schools may have received above business-as-usual instruction, it nonetheless seems clear that the strong design and rigorous implementation of Ignite Reading had a positive impact on the students who could access it. Neitzel and Reilly are effusive in their conclusion, saying that the intervention “has demonstrated substantial promise as a scalable, virtual tutoring solution for improving early literacy outcomes.” But that only holds true if there are a lot of new dollars available—from philanthropic organizations or elsewhere—ready to expand the program widely. Massachusetts does seem bullish on funding tutoring, but unless Ignite Reading can lower its cost (approximately $2,500 per student annually), even the $38 million state lawmakers have pledged over the next five years will only scratch the surface of the need.

SOURCE: Amanda J. Neitzel and Joseph Reilly, “An Evaluation of Ignite Reading Virtual Literacy Tutoring in Massachusetts,” The Center for Research and Reform in Education at Johns Hopkins University (December 2024).

view
Media alerts stock image

Fordham Institute media statement on Governor DeWine's budget

Ohio Education Gadfly
2.3.2025
Ohio Gadfly Daily

Today, Governor Mike DeWine released his biennial budget proposal, outlining his commitment to Ohio’s students through continued investment in key education areas including statewide literacy improvements, high-quality charter schools, and career and technical education. These measures are critical to ensuring that every student—regardless of zip code—has access to a high-caliber education that prepares them for success in college, careers, and beyond.

“Governor DeWine’s budget reinforces once again the importance he places on ensuring that every student reaches his or her potential,” said Chad Aldis, Vice President for Ohio Policy at the Thomas B. Fordham Institute. “By continuing Ohio’s bold literacy reforms, sustaining strong support for high-quality public charter schools, and expanding career and technical education, the governor is charting a path toward better opportunities for Ohio students.”

The proposal builds on Ohio’s recent efforts to implement the science of reading, a research-backed approach that has already shown promise in boosting literacy rates. It also strengthens career pathways for students by instituting a strong career planning requirement.

While the budget provides important investments in these key areas, the state’s school funding formula remains a lingering challenge. The Cupp-Patterson model, enacted in 2021, has proven both unsustainable and ineffective in key respects. These include a formula component that misallocates dollars intended to support low-income students, persistent use of “guarantees” to prop up districts losing enrollment, and elements that fail to control the inflationary costs of the formula. The legislature will need to confront these structural issues head-on to ensure that Ohio’s funding system is both fair and functional for all schools.

“High-quality schooling options and strong state investments in literacy and career education are crucial, but we cannot ignore the fact that our current school funding formula is not working as intended,” Aldis added. “Legislative leaders must take this opportunity to refine Ohio’s approach to funding education in a way that is both equitable and fiscally sustainable.”

view
Media alerts stock image

Fordham Institute media statement on 2024 Ohio NAEP scores

Ohio Education Gadfly
1.29.2025
Ohio Gadfly Daily

Today, the United States Department of Education released data from the 2024 round of the National Assessment of Educational Progress (NAEP), known as the “Nation’s Report Card.” These assessments are given to a representative sample of students from every state and provides one of the most comprehensive looks at student achievement across the nation. The exams are given biennially in grades four and eight, in math and reading.

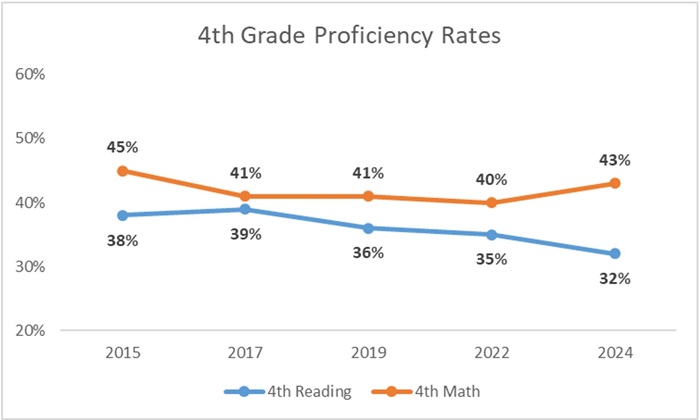
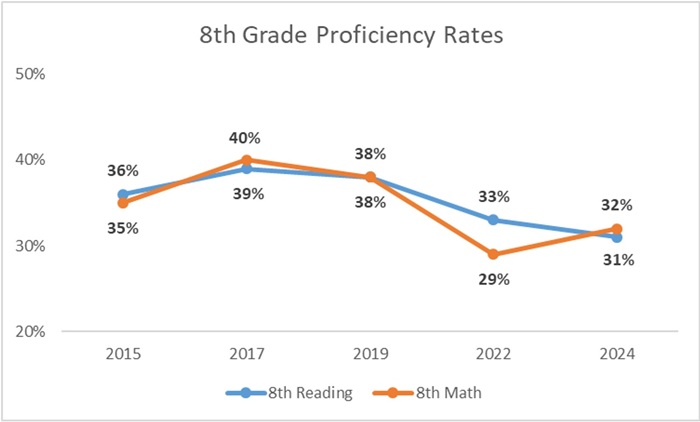
“Today’s NAEP results are a disappointment,” said Aaron Churchill, Ohio Research Director for the Thomas B. Fordham Institute. “Mirroring national trends, Ohio’s reading scores continue to be on an alarming slide. Results from math are more positive—Ohio’s proficiency rates ticked upward in both grades—yet still remain well below pre-pandemic levels in eighth grade.”

The figures below show the percentage of Ohio fourth and eighth graders achieving proficient on NAEP from 2015 to 2019 (pre-pandemic) and 2022 to 2024 (post-pandemic). Reading proficiency rates have declined in both grades since 2017. Fourth grade math proficiency has recovered to pre-pandemic levels, but eighth grade math proficiency still lags behind.

NAEP 2024 figure 1 4th grd

NAEP 2024 Figure 2 8th grd
Source: NAEP Data Explorer

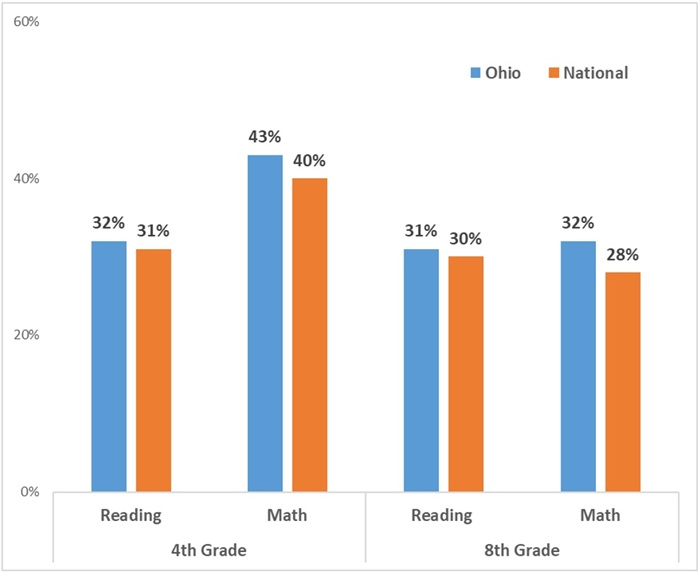
Consistent with historical patterns, Ohio continues to hold a slight edge in math and reading compared to the national average. In fourth grade math, for instance, 43 percent of Ohio students achieved NAEP proficiency versus 40 percent nationally. Note that the NAEP proficiency standard is a high academic bar—aligned more closely to a college-ready benchmark—which explains the lower NAEP proficiency rates when compared to proficiency rates on Ohio’s state exams.

Ohio NAEP 2024 Figure 3 OH Nat

“Overall, these results indicate that far too many Ohio students are struggling to master core math and reading skills,” continued Churchill. “That’s simply not good enough. To give students a boost, state leaders need to put math and reading back at the center of our education debates. Schools must ensure that students are in attendance, have their phones away, and are ready to learn. Teachers should be using effective instructional methods, including those aligned to the science of reading. Parents should be able to track their own child’s progress and be empowered to help if he or she is falling behind. An aggressive policy agenda that engages schools, parents, and students—and which focuses squarely on math and reading—is what Ohio needs to break through this academic malaise.”      

Fordham Logo

© 2026 The Thomas B. Fordham Institute
Privacy Policy
Usage Agreement

National

P.O. Box 110
Burke, VA 22009

202.223.5452

[email protected]

Ohio

P.O. Box 82291
Columbus, OH 43202

614.223.1580

[email protected]

Sponsorship

130 West Second Street, Suite 410
Dayton, Ohio 45402

937.227.3368

[email protected]