Mobile Navigation

  • National
    • Policy
      • High Expectations
      • Quality Choices
      • Personalized Pathways
    • Research
    • Commentary
      • Gadfly Newsletter
      • Flypaper Blog
    • Events
    • Scholars Program
  • Ohio
    • Policy
      • Priorities
      • Media & Testimony
    • Research
    • Commentary
      • Ohio Education Gadfly Biweekly
      • Ohio Gadfly Daily
  • Charter Authorizing
    • Application
    • Sponsored Schools
    • Resources
  • About
    • Mission
    • Board
    • Staff
    • Career
Home
Home
Advancing Educational Excellence

Main Navigation

  • National
  • Ohio
  • Charter Authorizing
  • About

Ohio Menu

  • Topics
    • Accountability & Testing
    • Advanced Education
    • Career & Technical Education
    • Charter Schools
    • Curriculum & Instruction
    • ESSA
    • Evidence-Based Learning
    • Governance
    • Personalized Learning
    • Private School Choice
    • School Finance
    • Standards
    • Teachers & School Leaders
  • Research
  • Policy
  • Commentary
    • Ohio Gadfly Newsletter
    • Ohio Gadfly Blog
    • Events

The Education Gadfly Weekly

Sign Up to Receive Fordham Updates

We'll send you quality research, commentary, analysis, and news on the education issues you care about.
Thank you for signing up!
Please check your email to confirm the subscription.

Ohio Gadfly—Make a 180-day school year the norm again

Volume 20, Number 9
4.28.2026
4.28.2026

Ohio Gadfly—Make a 180-day school year the norm again

Volume 20, Number 9
view
School calendar blog image
School Funding

Ohio should make the 180-day school year the norm again

For far too long, Ohio has been chipping away at instructional time in schools, with negative consequences for students. Here’s why the state must restore a baseline expectation that its schools are open for in-person instruction at least 180 days per year, 7 hours per day.

Aaron Churchill 4.28.2026
OhioOhio Gadfly Daily

Ohio should make the 180-day school year the norm again

Aaron Churchill
4.28.2026
Ohio Gadfly Daily

Ohio’s attendance dashboard is a step in the right direction

Jessica Poiner
4.27.2026
Ohio Gadfly Daily

Caught up in the machine: How employee hiring processes impact teacher and principal diversity

Jeff Murray
4.28.2026
Ohio Gadfly Daily

Longer-term impacts of remote learning during the height of Covid

Jeff Murray
4.23.2026
Flypaper
view
Attendance dashboard overview blog image

Ohio’s attendance dashboard is a step in the right direction

Jessica Poiner 4.27.2026
Ohio Gadfly Daily
view
CALDER teacher principal diversity SR image

Caught up in the machine: How employee hiring processes impact teacher and principal diversity

Jeff Murray 4.28.2026
Ohio Gadfly Daily
view
School closed sign

Longer-term impacts of remote learning during the height of Covid

Jeff Murray 4.23.2026
Flypaper
view
School calendar blog image

Ohio should make the 180-day school year the norm again

Aaron Churchill
4.28.2026
Ohio Gadfly Daily

Discussions about the “resources” needed to educate students usually revolve around money. Yet cold hard cash isn’t the sole “input” bearing on educational success. Time—both the length of school year and day as well as how those hours are spent—also makes a big difference. As a literature review by Matthew Kraft and Sarah Novicoff found, adding instructional time improves student achievement. Conversely, decreasing time (e.g., through four-day weeks) reduces achievement. Though not in their analysis, the disastrous pandemic-era experience made abundantly clear the massive negative impacts of diminished and disrupted learning time.  

Long before this research or Covid existed, the commonsense notion that time matters was stressed in the landmark Nation at Risk report (1983). There, the authors wrote:

We recommend that significantly more time be devoted to learning the New Basics. ... School districts and state legislatures should strongly consider 7-hour school days, as well as a 200 to 220-day school year.

The U.S. has never moved toward 200-day school year, at least not at scale. The historical standard at the time of a Nation at Risk, and still largely in place, is a 180-day school year. As the Pew Research Center reports, thirty-four states had a 180-day minimum in 1989, and thirty-one states required at least 180 days as of 2023.

Until 2014, Ohio had been one of the states requiring at least 180 days of pupil instruction. This standard, however, was abandoned amid a shift toward a minimum hour requirement. Today, district schools must be “open for instruction” each year for at least 910 hours in grades K-6 and 1,001 hours in grades 7-12.[1]

The move to hours was probably an effort to provide schools more flexibility around scheduling. But it’s also led to noticeably fewer days of pupil instruction and significant reductions in the amount of instructional time students receive each year—a problem that Ohio Representative Adam Bird pointed out in committee testimony last year.

To illustrate the reductions, consider the district where I live, Dalton Local. The board-approved calendar for 2025–26 included 176 days of pupil instruction, excluding a few staff PD days. The district cancelled seven days for weather and made up none of them. As a result, students will receive 169 days of instruction this year, provided the year concludes as planned. Given that the district hasn’t implemented a longer school day,[2] students will receive approximately a week to two weeks less instructional time this year than under Ohio’s 180-day requirement.[3]

A more startling example comes from Columbus. Its 2025-26 calendar starts with just 167 days of planned pupil instruction. The district likewise cancelled seven days for weather, resulting in just 160 days this year. The district operates the same daily bell schedule as it did in 2010 under the 180-day requirement. Without an extended school day, the significantly fewer days in session—as many as twenty (!) days less—indicates that Columbus students receive far less instructional time than their peers attending the district before the change to minimum hours.

America—Ohio included—is still very much a “nation at risk.” Student proficiency in math and reading sunk during the pandemic and recovery has been exceedingly slow. Longstanding achievement gaps remain unacceptably wide. As indicated by sky-high chronic absenteeism, too many students are MIA and ruining their chances of long-term success.

An abbreviated school year of 160 to 170 days simply won’t cut it. Lopping days off the calendar robs students of valuable learning time. Generous holiday breaks, disruptive cancellations, and the rise of professional learning days result in stop-and-go instruction that is surely less effective than consistent five-day-per-week instruction. Longer summer vacations only worsen “summer slide.” And a lower minimum opens the door to widespread use of four-day weeks—something a few Ohio schools have moved toward—which are terrible for students and burdensome to working families.

Ohio must restore a baseline expectation that its schools are open for in-person instruction at least 180 days per year, 7 hours per day. Time matters for students—and it’s past time for Ohio lawmakers to get schools back to a standard annual calendar. Clock’s ticking.


[1] Public charter schools must be open for 920 hours per year, though they are not allowed to count certain hours (e.g., recess) toward that minimum as districts may do. Neither district nor charter schools may count breakfast and lunch or extracurriculars toward the minimum.

[2] The bell schedules today are comparable to those described in the district’s 2008–11 teacher contract.

[3] Under prior law, districts were allowed three to five “calamity days” that were not required to be made up. In practice, then, districts would operate 175 to 180 days each year.

view
Attendance dashboard overview blog image

Ohio’s attendance dashboard is a step in the right direction

Jessica Poiner
4.27.2026
Ohio Gadfly Daily

In his state of the state address on March 10, Governor DeWine shined a spotlight on chronic absenteeism. He noted that students with good attendance are “three times more likely to be proficient readers, nearly four times more likely to be proficient at math, [and] almost twelve times more likely to graduate on time.” It’s worrisome, then, that one out of every four Ohio students was chronically absent last year.[1]

Traditionally, Ohio only publishes attendance data once a year, when it releases state report cards in September. When those data are released, chronic absenteeism rates make headlines. But then the numbers get stale. They’re viewed as last year’s issue, not a current one. And that makes it easy for local officials, district and school leaders, and families to let their guard down and overlook the importance of daily attendance.

Access to real-time data could help. That’s why DeWine announced in his address that the Department of Education and Workforce (DEW) would be launching a new statewide attendance dashboard. The tool, he said, would provide administrators, educators, parents, and the public with “simple, fast, and transparent attendance data each week.” This information could then be used to take “actionable steps to improve attendance.”

The dashboard went live on April 15. As promised, it allows the public to track statewide attendance trends and chronic absenteeism rates by district, school building, and grade level. It offers a chart that displays absence trends over time via a line graph, as well as a table that displays results for the most recent week. Data can be disaggregated into four categories of students: Satisfactory (those missing less than 5 percent of class time); At risk (missing 5–10 percent); Moderate (10–20 percent); and Severe (more than 20 percent). Users can also compare results across districts. A leaderboard identifies top-performing districts and those trending in the right direction.

Right now, schools must choose to participate. Unfortunately, some are refusing. During the launch announcement, DEW Director Steve Dackin said that roughly 24 percent of districts hadn’t yet uploaded their data to the dashboard. Among them are two of Ohio’s largest: Columbus City Schools and Cleveland Municipal. They also happen to be districts where significant numbers of students—52.6 and 55.7 percent, respectively—were chronically absent last year.

Dackin noted that many districts haven’t uploaded their data because of technical difficulties. DEW is working with them to resolve those issues. But DeWine added that there are “a few schools who don’t seem to have a technical problem. They just have not gotten on.” Jocelyn Rhynard, a board member from Dayton Public Schools (DPS), told the Dayton Daily News that her district is “considering” participating. But she also “expressed trepidation with a system that she said leaves out a great deal of information about why some districts might have higher absenteeism rates than others, like a higher proportion of homeless youth or students in group homes.”

This is disappointing to hear from a district official for two reasons.

First, because it prioritizes adults over kids. Instead of viewing the dashboard as an opportunity to be transparent with the families who trust DPS with their kids, and the taxpayers who trust DPS with their hard-earned dollars, district officials are choosing to conceal data. It seems they’d rather avoid difficult questions than acknowledge a problem and provide evidence of their efforts to address it. They appear more interested in how the dashboard might make them look than what the numbers mean for kids’ futures. Remember, the dashboard is information-only. It has no ties to the state accountability system. Districts and schools that refuse to participate aren’t sidestepping state-leveled sanctions. They’re just shielding their attendance numbers from public view.

Second, because it’s a huge missed opportunity. The dashboard provides real-time data that district and school officials can use to identify issues as they occur and address them before they snowball into a bigger problem. Does a nearby district or charter school have better attendance numbers among its at-risk youth? Then schedule a visit, identify what’s working, and implement it. The dashboard makes it possible to learn from other schools. And since it’s updated weekly, district officials will have immediate feedback about whether their efforts are working. Moreover, as was the case in Rhode Island, real-time data can help mobilize not only educators and families but also lawmakers, hospitals, businesses, and other stakeholders who can offer additional support.

The hundreds of schools that have already submitted data deserve credit for putting students and transparency first. But if some districts continue to prioritize adult interests over those of kids, lawmakers should consider making the dashboard mandatory. Years of taskforce recommendations, attendance guides, and pledges have yet to move the needle. Real-time data could help—but only if everyone gets on board.


[1] Chronic absenteeism is defined as missing at least 10 percent of instructional time for any reason.

view
CALDER teacher principal diversity SR image

Caught up in the machine: How employee hiring processes impact teacher and principal diversity

Jeff Murray
4.28.2026
Ohio Gadfly Daily

Efforts to broaden the demographics of the U.S. teaching force have yielded change, but more remains to be done to better reflect the diversity of the student body. A group of researchers led by Dan Goldhaber from the American Institutes for Research and the University of Washington suspect that multi-layered hiring processes may introduce heretofore unstudied points of friction. Their recent working paper digs into the question.

The researchers’ main data source is a company called Nimble Hiring, which provides recruitment, candidate screening, job offers, contracting, and onboarding services for dozens of education providers in several U.S. states. These include preschools and private schools, but the present study utilizes only data from public K-12 education providers (18 traditional districts and 24 charter school networks) that contract with Nimble. No geographic data is provided on where these are located, although Nimble’s website only lists five states in which they work.

Goldhaber and team combine these data with publicly-available organizational and demographic characteristics via the Common Core of Data. Their records cover job postings and applications for both teachers and principals from January 2019 through September 2024. They standardize the hiring process into four stages: (1) initial screening by central HR, (2) application made visible to school-level personnel, (3) engagement with school-level personnel (e.g., interviews), and (4) job offer. They then track all applicants through these stages, looking to see how the racial composition of applicants changes as candidates advance (or not) and how those advancement patterns vary across organizations with different characteristics (e.g., student demographics).

The findings start with applicant demographics. Sixty-three percent of teacher applicants were female, and female applicants were hired at significantly higher rates than males. The teacher applicant pool was more racially diverse than the teacher workforce in general, with 35.6 percent identifying as one of several underrepresented groups (specifically, Black, Hispanic, or Native American). However, White applicants were significantly overrepresented among applicants with offers (41 percent of all applicants, but 52 percent of applicants with job offers) and Asian applicants were significantly underrepresented (13.7 percent of all applicants, but only 5.7 percent of those with offers). Black applicants are slightly underrepresented among candidates with offers and Hispanic applicants are slightly overrepresented.

While the demographics of principal applicants were similar to those of teachers—also more diverse than the principal workforce in general—hiring patterns for principal positions were somewhat different. Black applicants maintained roughly proportional representation (34.2 percent of offers versus 33.6 percent of applicants), White applicants were slightly underrepresented among those receiving offers, Asian applicants were significantly overrepresented (only 2.7 of all applicants, but 5.6 percent of offers), and Hispanic applicants were slightly overrepresented.

For the most part, with respect to teacher hiring, the early screening stages appeared to be responsible for the majority of these job offer disparities. Black and other non-White applicants were significantly less likely to advance through each of the first three stages of the hiring process than their White peers. However, once they did so and were engaged at the school level (such as being invited for an interview), White and non-White applicants were equally likely to receive a job offer. Hispanic applicants appeared to be particularly disadvantaged at the second stage of the hiring process (when applications were made visible to school-level personnel), while Asian applicants were significantly less likely than their peers to advance at all four stages. Female applicants were more likely to advance at each of the first three stages than their male peers, but were equally likely to get job offers once engaged by school personnel.

The researchers saw no statistically significant relationship between non-White and White principal applicants and their overall likelihood of receiving a job offer at any stage. However, the analytical sample of jobs is far smaller than for teachers, so these findings need to be taken with a grain of salt. Female principal applicants showed a small but statistically-significant higher likelihood of receiving a job offer than their male peers.

Finally, Goldhaber and his team also found that organizations with higher proportions of underrepresented minority students were more likely to hire Black and Hispanic applicants overall—both teachers and principals. Charter schools particularly were more likely to hire non-White teacher applicants.

The researchers explain that the mechanisms at work are nuanced. Nimble’s recruiting system does not require racial/ethnic demographic information from any applicant, and any such detail voluntarily provided (say, via a personal essay) is not revealed to non-HR personnel until stage three. They conclude, then, that disparities observed in the first stage are likely driven by a mix of candidate preferences or actions (such as withdrawing an application after submission) and what they term “coarse” screening methods used to winnow down a large number of submissions. In the second stage, nearly all decisions—and the disparities that result—are driven by HR screening processes which likely include a mix of electronic and human-centric reviews. “At this point,” they write, “either screening instruments [the schools] use are biased, implicit or overt human bias operates, or job-relevant factors excluded from our analysis but correlated with race differ.”

That’s the bad news. The good news is that the final stages, when candidates interact with non-HR school personnel, show minimal disparities. All of which means that schools looking to diversify their teacher and principal workforce must focus on refining their earliest screening processes to make sure that no particular racial or ethnic group is being disproportionately caught up in the machine.

SOURCE: Dan Goldhaber et al., “School System Selection Processes and Workforce Diversity in Schools,” CALDER Working Paper (February 2026).

view
School closed sign

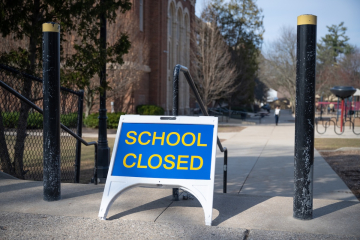
Longer-term impacts of remote learning during the height of Covid

Jeff Murray
4.23.2026
Flypaper

It’s been six years since the Covid-19 pandemic began disrupting education, and a varying number of years since schools returned to “normal,” but data charting the numerous negative impacts on students keep coming. Two recently-published reports separately focus on attendance and math achievement.

First up is Jeremy Singer, a researcher from the University of Michigan-Flint, looking at post-pandemic student attendance trends as a function of how much remote learning a student experienced during Covid disruptions. Absenteeism increased during the two most-impacted Covid years, and overall, remains higher today than in pre-Covid years.

Singer uses data from Michigan covering every public school in the state during the 2020–21 school year. Schools were required to report their current learning modality (fully in-person, fully online, or a mix/option of the two) to the state every month. Singer created a measure of remote learning duration to which more than 992,000 students were exposed in 2020–21 and tracked their attendance from the 2017–18 through the 2023–24 school years—a total of more than 5,100,000 observations. He then tested the differential impact of remote learning exposure via both difference-in-differences and instrumental variable analyses. Neither set of findings is causal because exposure to remote learning was not random (and was often an affirmative parental choice), but they correlate strongly with each other.

The topline finding is that the longer students experienced remote learning in their schools, the worse their post-pandemic attendance was when compared to pre-pandemic patterns. Yet the impacts were not linear. Compared to students who were never provided with remote-only learning in 2020–21, students provided with remote-only learning for one, two, or three months had no statistically-significant decline in attendance post-pandemic; those with remote-only learning for four, five, or six months subsequently missed a few additional days of school; and those with remote-only learning for seven, eight, or nine months missed substantially more. Consistent with other data, negative impacts were strongest for Michigan students in 2021–22 and 2022–23, although they were still seen at a statically-significant level well into the 2023–24 school year among those with the most exposure to remote-only learning.

Given these findings—and the fact that more than 80 percent of Michigan students were in the low-exposure category—current absenteeism woes in the state can’t be neatly pinned on Covid-era remote learning. And generalizability beyond the Michigan context is also unclear. In fact, Singer suggests that his findings might say as much about the quality of the “cure” (absenteeism-mitigation strategies implemented in the wake of shocking early data) as they do about the strength of the “disease” of remote learning itself.

And what of academic outcomes impacted by Covid-era instructional modality changes? A pair of researchers from the University of Western Ontario examine the ways in which math course-taking among high schoolers in Massachusetts changed in 2020–21, including the extent of exposure to remote learning.

Their dataset comprises more than 327,500 unique students who were in grades 9 or 10 in the 2016–17 through 2019–20 school years, and who transitioned into grades 10 or 11 in 2017–18 through 2020–21—a total of more than half a million student-year records. The choice of grades is deliberate to (a) avoid the first year of high school, often a tricky transition generally; and (b) maximize the evidence of students’ progression (or not) through a typical high school course sequence from basic math to Algebra I and II to geometry to pre-calculus and beyond. Data from the Massachusetts Department of Elementary and Secondary Education comprised a detailed transcript for each student, including math classes attended, completion (or not), and academic performance therein. Instructional modality changes during the 2020–21 school year were tracked similarly to the Singer study above, using the Bay State’s contemporaneous school survey data.

The researchers find that overall rates of advancement for students (that is, taking a higher-level math course in one year compared to the prior one) decreased during the 2020–21 school year, with stronger negative impacts seen among students who spent a greater share of the year in remote-only instruction mode.

Students in grade 10 in 2019–20 slightly decreased the rate at which they advanced in math and markedly increased the rate of repeating their grade 9 math class, as compared to pre-pandemic trends. In 2020–21, these patterns were even stronger. Just 65 percent of students who spent all or nearly all of the school year in remote instruction took a higher-level math course in grade 10 than in grade 9. Those high-exposure grade 10 students were much more likely than their in-person peers to take a course below their grade level (meaning Algebra I or lower), to receive lower marks in whatever math course they took, and to fail or withdraw from a math course. Students in grade 11 showed a similar pattern of impacts. Economically disadvantaged, Black, and Hispanic students fared worse across the board than their White and Asian peers. The researchers ran additional multilevel logistic regression models to attempt to account for some student- and school-level factors. While, the randomness of exposure to remote learning does not allow their efforts to produce causal findings, all analyses showed similar patterns.

The math report concludes by pointing out that halted progress during a course sequence—for any reason—tends to stop students from building upon math knowledge, rendering future progress unlikely or at least very difficult. That’s a particularly chilling prospect given that the Massachusetts students in question long ago left high school, many with the assistance of lowered graduation requirements implemented during Covid, making whatever damage has been done to their math learning solely their problem to deal with.

The attendance report does not discuss differential impacts based on grade level, but the same holds true regardless: Whatever damage was done by students’ exposure to remote learning in 2020–21 (and indeed whatever benefit of mitigation they may have experienced afterward), all of it was cemented in when they graduated. For Covid-impacted students who have not yet graduated, their schools owe it to them to learn from the continuing stream of data documenting harm and to triple down to alleviate it in whatever time remains—focusing solidly on those kids who experienced the most remote-only learning.

SOURCES: Jeremy Singer, “Remote Learning in 2020-21 and Student Attendance Since the COVID-19 Pandemic,” EdWorkingPaper, Annenberg Institute at Brown University (January 2026); and Patrick Denice and Shahar Dangur-Levy, “Math coursetaking trajectories in high school during the COVID-19 disruptions to schooling,” EdWorkingPaper, Annenberg Institute at Brown University (March 2026).


Fordham Logo

© 2026 The Thomas B. Fordham Institute
Privacy Policy
Usage Agreement

National

P.O. Box 110
Burke, VA 22009

202.223.5452

[email protected]

Ohio

P.O. Box 82291
Columbus, OH 43202

614.223.1580

[email protected]

Sponsorship

130 West Second Street, Suite 410
Dayton, Ohio 45402

937.227.3368

[email protected]