Mobile Navigation

  • National
    • Policy
      • High Expectations
      • Quality Choices
      • Personalized Pathways
    • Research
    • Commentary
      • Gadfly Newsletter
      • Flypaper Blog
    • Events
    • Scholars Program
  • Ohio
    • Policy
      • Priorities
      • Media & Testimony
    • Research
    • Commentary
      • Ohio Education Gadfly Biweekly
      • Ohio Gadfly Daily
  • Charter Authorizing
    • Application
    • Sponsored Schools
    • Resources
  • About
    • Mission
    • Board
    • Staff
    • Career
Home
Home
Advancing Educational Excellence

Main Navigation

  • National
  • Ohio
  • Charter Authorizing
  • About

Ohio Menu

  • Topics
    • Accountability & Testing
    • Advanced Education
    • Career & Technical Education
    • Charter Schools
    • Curriculum & Instruction
    • ESSA
    • Evidence-Based Learning
    • Governance
    • Personalized Learning
    • Private School Choice
    • School Finance
    • Standards
    • Teachers & School Leaders
  • Research
  • Policy
  • Commentary
    • Ohio Gadfly Newsletter
    • Ohio Gadfly Blog
    • Events

The Education Gadfly Weekly

Sign Up to Receive Fordham Updates

We'll send you quality research, commentary, analysis, and news on the education issues you care about.
Thank you for signing up!
Please check your email to confirm the subscription.

Ohio Education Gadfly Biweekly--Volume 12, Number 20

Volume 12, Number 20
10.1.2018
10.1.2018

Ohio Education Gadfly Biweekly--Volume 12, Number 20

Volume 12, Number 20
view
Standards & Accountability

Wave away test scores at your own risk

In fashion these days are craft breweries, shabby-chic decor, and farm-to-fork restaurants. But what’ll get you a seat at the cool-kids table in the education world? At the top of the list is dismissing—or is it “dissing”?—standardized test scores. Just consider some of the latest reactions, fresh off the release of Ohio’s 2017–18 school report cards.

Aaron Churchill 10.1.2018
OhioOhio Gadfly Daily

Wave away test scores at your own risk

Aaron Churchill
10.1.2018
Ohio Gadfly Daily

Ohio needs to be careful with GPAs

Jessica Poiner
9.25.2018
Ohio Gadfly Daily

Civil rights and education funding in Ohio

Chad L. Aldis
10.8.2018
Ohio Gadfly Daily

Tackling Ohio’s toughest education challenges: Create a curriculum-review committee

Ohio Education Gadfly
10.8.2018
Ohio Gadfly Daily

Pathway to Success: Menlo Park Academy gives gifted children a unique space where they can thrive

9.26.2018
Report

Do private schools avoid voucher programs because of excessive regulation?

Jeff Murray
10.3.2018
Flypaper
view

Ohio needs to be careful with GPAs

Jessica Poiner 9.25.2018
Ohio Gadfly Daily
view

Civil rights and education funding in Ohio

Chad L. Aldis 10.8.2018
Ohio Gadfly Daily
view

Tackling Ohio’s toughest education challenges: Create a curriculum-review committee

Ohio Education Gadfly 10.8.2018
Ohio Gadfly Daily
view

Pathway to Success: Menlo Park Academy gives gifted children a unique space where they can thrive

Lyman Millard 9.26.2018
Report
view

Do private schools avoid voucher programs because of excessive regulation?

Jeff Murray 10.3.2018
Flypaper
view

Wave away test scores at your own risk

Aaron Churchill
10.1.2018
Ohio Gadfly Daily

In fashion these days are craft breweries, shabby-chic decor, and farm-to-fork restaurants. But what’ll get you a seat at the cool-kids table in the education world? At the top of the list is dismissing—or is it “dissing”?—standardized test scores. Just consider some of the latest reactions, fresh off the release of Ohio’s 2017–18 school report cards. An unnamed Columbus City Schools official told the Dispatch, “There’s far more to measuring a child’s learning and growth than what’s scored on the state’s annual Local Report Card, which offers only a limited snapshot.” The Zanesville superintendent told his local  paper, “When we look at that [report card data], I don't think it accurately reflects the work of our students and teachers.” Up in Northeast Ohio, a local school official told the Akron Beacon Journal, “I’m not panicked because state tests suggest we do poor in a certain area. I don’t necessarily think state tests are valid and reliable.”

It’s true that test scores don’t capture important intangible qualities of schools. And yes, students are “more than test scores”; they also need to develop character traits that enable them to live as responsible adults. But none of this gives us license to wave away test scores. Whether we like them or not, standardized exams in math and English remain important markers of whether students are on-track for success later in life.

Let’s look at the relationship between state test scores—using the performance index, a composite measure of achievement on all state exams—and college completion rates, as reported on Ohio’s 2017–18 report cards. But before diving in, a few caveats. One, the charts below don’t show the test scores and college outcomes of the same students; this requires data that tracks pupils over time. Second, they do not consider districts’ “value added” contributions to test scores or completion rates apart from students’ background (we don’t have data on completion). Since the following charts are not meant to single out districts for their effectiveness or lack thereof, their names are removed. Lastly, the data are correlational—a number of other factors might drive college completion rates.

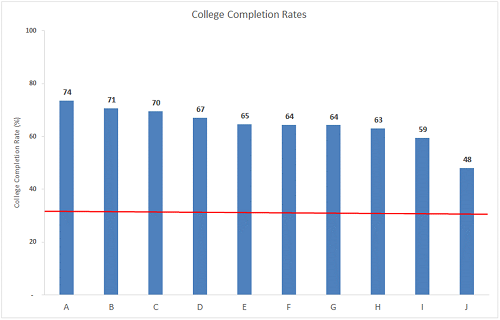
The results, while not scientific proof, point to a positive relationship between student test scores and post-secondary outcomes. Figure 1 shows the ten highest-performing districts on the state’s performance index. All of these high-test-scoring districts have much higher percentages of their alumni complete college than the statewide average of 33 percent (shown in the red bar). Is it a perfect correlation? Well, no. One district, for example, posted sky-high test scores last year but only modestly above average college completion rates.[1] Of course, at a student level we’d invariably find young people who tested well but didn’t complete college, and vice-versa. Still, on balance, graduates of Ohio’s high-achieving districts tend to fare well in terms of completing a college degree—a result that matches most of our intuitions about the relationship between achievement in K–12 and success in college.

Figure 1: College completion rates of the ten highest performing districts on Ohio’s 2017–18 Performance Index

wave away figure 1

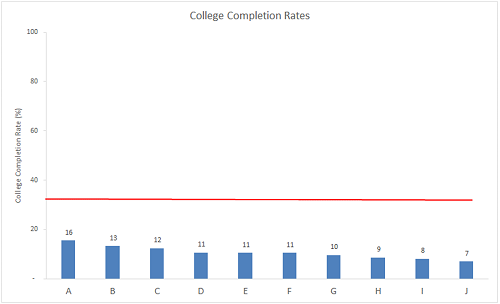
Note: This chart displays the percentage of district graduates in the class of 2011 who completed a two- or four-year college degree six years after finishing high school. The red bar displays the statewide college completion average of 33 percent for this graduating class. The same note applies for figure 2.

Now let’s look at the other end of the spectrum. What are the college-completion rates among districts that have the lowest test scores in the state? Figure 2 shows that a paltry one in ten students who attended these low test scoring districts graduated from college, a rate that is well beneath the statewide average of 33 percent. The lower completion rates reflect in part lower college enrollment rates among students from these districts.

Figure 2: College completion rates of the ten lowest performing districts on Ohio’s 2017–18 Performance Index

wave away figure 2

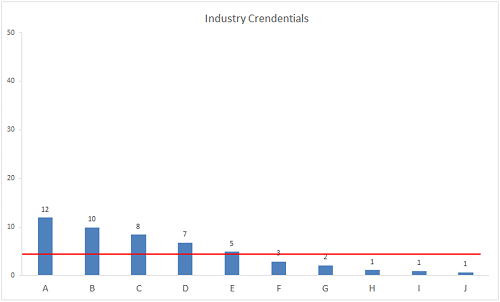
Graduates may be foregoing college and pursuing highly skilled careers right after high school instead. The data on workforce outcomes of young people are unfortunately not readily available (something that should change), so the best indicator we have on hand is whether students earn industry-recognized credentials that can open career doors for students of all backgrounds. Figure 3 shows that small fractions of graduates from low-achieving districts earn industry credentials—though encouragingly, a few of the lowest-achieving districts have higher industry credentialing rates than the statewide average of 4.4 percent.[2] Taken on the whole, however, figures 2 and 3 paint a troubling picture about the college or career outcomes of the vast majority of young people who attend low-test-scoring districts.

Figure 3: Industry credentialing rates of the ten lowest performing districts on Ohio’s 2017–18 Performance Index

wave away figure 3

Note: This chart displays the percentage of graduates in the classes of 2016 and 2017 who completed an industry-credentialing program before graduation. The red bar displays the statewide industry-credentials-earned average of 4 percent for these graduating classes. These percentages predate the state’s new graduation requirements, which encourage career-and-technical students to pursue credentials.

***

As the editorial board at the Toledo Blade recently did, some will chalk up low-performing districts’ results to poverty. Sadly, there remains a link between students’ achievement and their background characteristics—one that reformers have long sought to break (and some Ohio schools are indeed doing). But the answer isn’t to excuse away test scores or stick our heads in the sand and pretend like they don’t matter. As the figures above suggest, state exam results are important signals about the knowledge and skills students possess—the “human capital” that is critical to success in today’s colleges and workplaces. Standardized tests may never win popularity contests, but that isn’t the point. They offer communities insight into how many students are on a pathway for success after high school, and provide parents with information on whether their own children are keeping pace. In some cases, test results foreshadow good things to come, while in others they show just how far we need to go.


[1] When considering all Ohio districts, the correlation between the performance index and college completion rates is strong (r = +0.78). A correlation of +1.0 would indicate a one-to-one positive relationship between the performance index and completion rates, while 0.0 would indicate no correlation.  

[2] Though not displayed here, Ohio’s high-achieving districts also have few students earning credentials (less than 2 percent across the top performing districts on the performance index).

view

Ohio needs to be careful with GPAs

Jessica Poiner
9.25.2018
Ohio Gadfly Daily

At this month’s meeting of the State Board of Education, members debated a draft proposal for a new set of graduation requirements that would give students many paths to graduation. One would use grade point average (GPA) as an indicator of competency. Students would have to earn an average GPA of 2.5 or better for at least two full years of high school math and English, as well as a 2.5 or better across four semesters of any single subject included in the “well-rounded” category that comprises science, social studies, art, and foreign language. The upshot is that a student could earn an Ohio diploma by earning a 2.5 GPA in certain courses (not overall) and playing a sport for four years.

It shouldn’t come as a surprise that Ohio education officials want to include GPA in state graduation requirements. The strategic plan for education released earlier this month called for the state to develop multiple ways for students to demonstrate their competency, and the main goal statement purposely shies away from measures like standardized tests. There is also research that shows a link between college success and a students’ high school GPA. For example, an Institute of Education Sciences study found that high school GPAs are an “extremely good and consistent predictor of college performance,” and that they “encapsulate all the predictive power of a full high school transcript in explaining college outcomes.”

But there is also evidence that indicates widespread grade inflation. A recent Fordham-published analysis by Seth Gershenson of American University examined public school students taking Algebra I in North Carolina and found that a significant number of students who received high grades in that class did poorly on the state’s end-of-course (EOC) exam. Specifically, more than one-third of students who received B’s from their teachers failed to score proficient on the exam. That’s a pretty big deal, since the state’s Algebra 1 EOC is not only strongly predictive of math ACT results, but more predictive than course grades. Interestingly, the data show that more grade inflation occurred in schools attended by more affluent students. Research from the College Board, as reported by The Atlantic, found similar results: Students enrolled in private and suburban public high schools were awarded higher grades than their urban peers despite similar levels of talent and potential. In fact, between 1998 and 2016, the GPAs of students at private and suburban public high schools went up even as scores on the SAT went down.

Evidence of grade inflation points toward at least one serious issue with using GPA as a graduation pathway. Allowing students to graduate based on their average in certain classes instead of an overall GPA puts enormous pressure on the educators teaching those classes. If a student’s diploma is on the line, and it comes down to assigning an accurate grade or a slightly inflated one, teachers will be stuck between a rock and hard place. Do they choose honesty, and face potential backlash from administrators worried about graduation rates or parents worried about their kids? Or do they inflate the grade a little and sidestep all the drama and potential consequences? Without an objective third party—like state tests, the ACT, or industry certifications—certain high school teachers could become the sole gatekeeper of diplomas.

Ohioans saw this play out firsthand a few years ago, when administrators in Columbus City Schools took it upon themselves to withdraw students with poor attendance and low test scores and alter student grades. The auditor’s review of a sample of letter-grade changes found that over 83 percent of the data tested had no documentation that supported the need for a grade change. One assistant principal changed more than 600 grades from failing to passing because he believed “no student should get an F.” Ohio isn’t the only place this has happened, either. The scandal at Ballou High School in Washington, D.C.—and the intense pressure that was put on teachers there—offers a similar warning. 

To be clear, the conclusion to draw here is not that teachers and administrators are bad guys ready to game the system, or that standardized tests like EOCs or the ACT/SAT are way more reliable than GPAs and grades. The point is that each measure has its own value and place. In fact, there are studies that show that a student’s GPA and her composite ACT score are more predictive of college success than either option alone. There’s a reason that the vast majority of colleges still ask for multiple measures of a student’s ability, including GPA, class rank, test scores, and letters of recommendation. Likewise, there’s a reason that Ohio’s current graduation requirements depend on passing certain courses (which translates to a decent GPA) and demonstrating competency via an objective assessment. A system that considers both ensures not only the honesty of both measures, but provides a clearer picture of the student as a whole.

Of course, none of this changes the fact that the recently proposed graduation requirements would allow students to graduate based almost solely on course grades and their resultant GPA. In a previous piece, I outlined a few other reasons why policymakers should be careful with GPAs. Since the issue is once again at the center of a statewide debate, it’s worth reviewing them again.

First, comparability is a serious problem. GPA calculations vary widely across schools—there is no standard way of computing them, or verifying that a 2.5 at Whetstone High is the same as a 2.5 at New Albany High. Even colleges that have gone test-optional, like the University of Chicago, have admitted that GPAs don’t tell them much: “Since one school can be very different from another, it is useful to see evidence of academic achievement that exists outside of the context of your school,” their admissions page says.

Second, most of the research on the predictive power of GPAs only considers how students perform once they get to college. That ignores a huge part of the student population—students who don’t enroll in college and thus don’t have postsecondary outcomes to compare to their high school GPA. This likely includes a large portion of the cohort of students who are unable to pass Ohio’s end-of-course exams. Some of these students may have wanted to enroll in college but could not because their applications were denied. Others may have gotten accepted to a school and then simply chosen not to go. Without an accurate way to measure whether these students’ GPAs would also have predicted college success, it’s difficult to say how useful GPA is as a predictive tool for everyone.

Third, there is very little research linking GPAs and workforce success. Ohio graduates work in thousands of different jobs in dozens of fields, and because each field and role is unique and complex, it’s difficult to determine on a broad scale whether students are adequately prepared for the workforce. In fact, the only clear data Ohio seems to have on gauging career readiness come from the WorkKeys assessment—a standardized test. It seems like a serious oversight to give students a diploma based on their GPA when so many employers have said that graduates—many of whom have decent GPAs—are missing important skills.

Fourth, it’s inaccurate to claim that GPAs are more predictive of college success than our current state tests. The majority of studies that examine whether GPAs predict college success use placement tests (like ACCUPLACER) or readiness tests (like the ACT or SAT) as their points of comparison. Some studies use state tests, but those come from other states. No study yet examines how well Ohio’s EOCs can predict success at the collegiate level. If policymakers are determined to claim that GPAs are a better indicator of readiness than state EOCs, then they need to commission independent research to prove it.

Standardized tests don’t tell us everything we need to know about student potential, achievement, or ability. But neither do GPAs. As the old saying goes, it’s important to trust but verify. Given that GPAs are subject to grade inflation, aren’t easily comparable across schools and districts, and don’t clearly measure workforce readiness, policymakers should remain skeptical of relying on them as a graduation standard.

view

Civil rights and education funding in Ohio

Chad L. Aldis
10.8.2018
Ohio Gadfly Daily

NOTE: On September 14, 2018, Chad Aldis was invited to provide testimony to the Ohio Advisory Committee to the U.S. Commission on Civil Rights. The meeting, held in Cleveland, examined civil rights as it relates to education funding in Ohio. The big question in front of the committee was “whether the state’s school funding system contributes to a disparate impact on educational outcomes for student groups protected under federal law.” The following is a summary of Chad’s remarks compiled from his notes.

The Thomas B. Fordham Institute’s long-term focus on school quality and student achievement makes us very appreciative of the work of this advisory committee. Any aspect of the education system that could be contributing to the racial achievement gap must be identified and corrected.

Today, I’ll provide information in a variety of areas that are likely to be relevant to the analysis this committee will conduct, including student achievement, funding data, the relationship between funding and academic achievement, and data related to charter schools. Finally, I’ll identify a few areas where Ohio can improve its funding system and offer a few final thoughts.
 

Achievement gap data

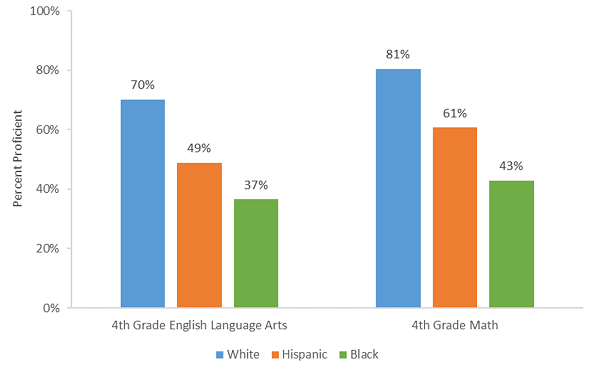
Using data from the 2016–17 school year, compiled by the Ohio Department of Education, the following figures reflect student achievement by race and ethnicity.

Figure 1, focused on elementary grades, shows a pronounced achievement gap in fourth grade by race/ethnicity in both math and English language arts. White students (in blue) achieve proficiency at a much higher rate than both Hispanic students (in orange) and black students (in green). 
 

Figure 1: Fourth grade state exams proficiency by selected race/ethnic subgroups, 2016–17
DI 1

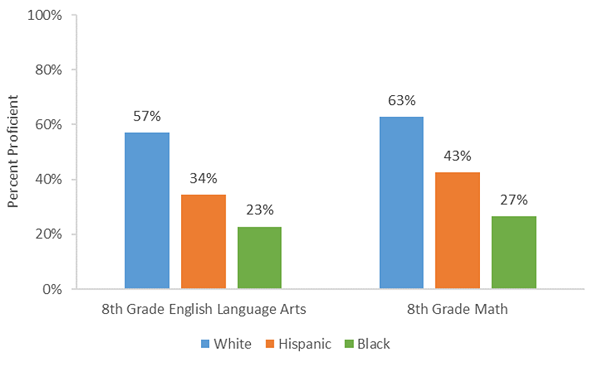
Figure 2 shows the same data for eighth grade, giving us a look at middle school. The only change, depressingly, is that the proficiency level goes down for all students in both subjects. The gaps, however, remain largely unchanged.

Figure 2: Eighth grade state exams proficiency by selected race/ethnic subgroups, 2016-17
DI 2


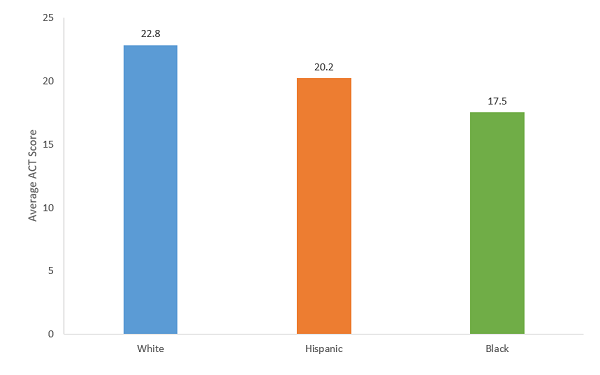
Figure 3 looks at high school achievement. Specifically, average composite scores on the ACT for the Class of 2017. Even in high school, the sizable achievement gap remains.

Figure 3: ACT composite scores by selected race/ethnic subgroups Ohio’s class of 2017
DI 3

Source: ACT profile report for Ohio.

Just for context, in past years, roughly two in three students in Ohio took the ACT. Starting with the Class of 2018, all public school students are required to take either the ACT or SAT, including those who are not planning to attend college. Given the increased number of students taking the exam, this is likely to reduce scores across all subgroups.

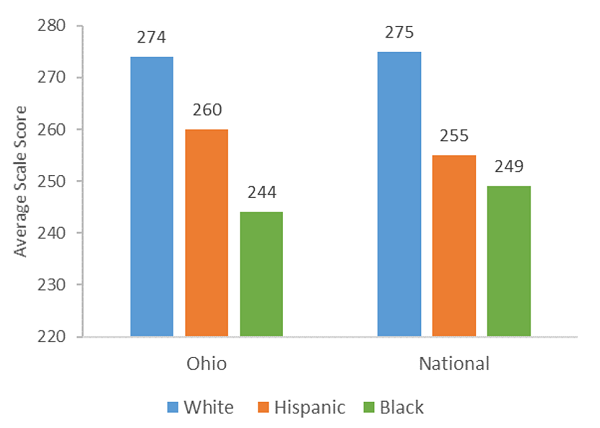
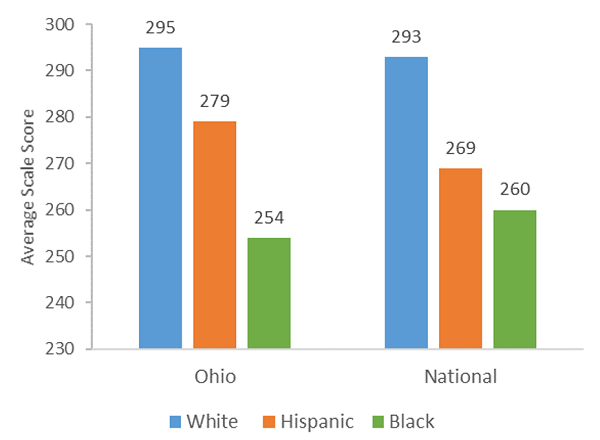
While the focus is on Ohio students, we also thought it would be worth knowing whether similar achievement gaps were present across the nation. As Figures 4 and 5 show, the Ohio achievement gap in eighth grade on the NAEP assessment (often called the Nation’s Report Card) is similar to the national gap. Ohio has a slightly narrower achievement gap than the nation between white and Hispanic students and slightly wider between white and black students.

Figure 4: Eighth grade NAEP reading scores Ohio and national averages by selected race/ethnic subgroups, 2017
DI 4

Figure 5: Eighth grade NAEP math scores Ohio and national averages by selected race/ethnic subgroups, 2017
DI 5

These data make it clear that the achievement gap problem isn’t limited to Ohio.
 

Funding

Having established that there is a difference in educational outcomes by race, I’ll shift my focus to school funding data. It is important to note that the expenditures in the following figures are operational expenses—things like instruction, support services, and books. It excludes such things as construction, interest, and land. Districts spend on average about $1,500 per pupil on non-operational expenses. And Ohio’s statewide average for FY 2017 is $11,603 per pupil. Importantly, the expenditures analyzed here include federal dollars, which are often targeted to low-income and minority students.

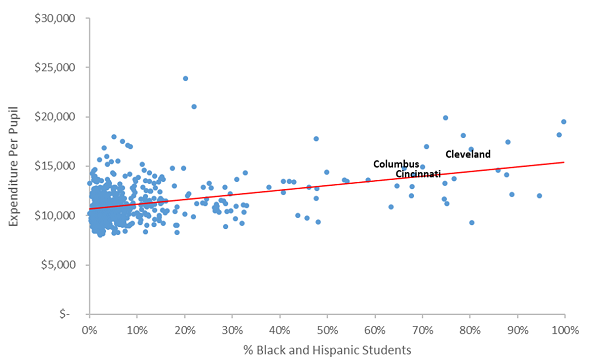
The scatterplot in Figure 6 shows the expenditure per pupil by district (each blue dot represents a district) compared to the percent of black and Hispanic students in that district.

Figure 6: Operating expenditures per pupil versus black and Hispanic enrollment Ohio school districts FY 2017
DI 6

Source: ODE, District Profile (Cupp) Reports (FY 2017).

As you can see by the cluster of blue dots on the left side of the chart, a large majority of Ohio districts enroll less than 10 percent black and Hispanic students. Per-pupil funding in these districts varies widely, with most spending between $9,000 and $15,000.

Overall, the trend line is slightly upwards. This means that as the percent of black and Hispanic students in the district increases, so does the per-pupil funding.

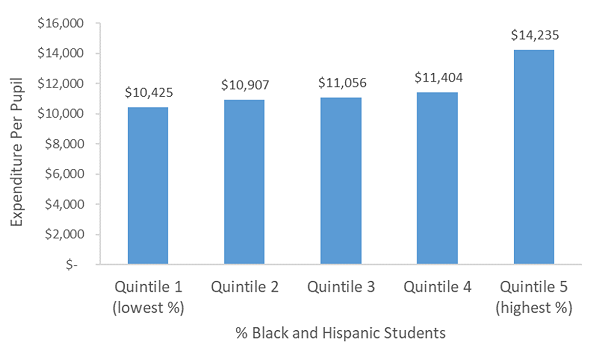
Figure 7 shows the same data in a slightly different way. Here, districts are split into five equal enrollment groups (quintiles) based on their percentage of black and Hispanic students. Scatter plots are nice, but they don’t tell the entire story because each point is treated as if each district were the same size. The bar chart helps show that the large urban districts, because of the large number of black and Hispanic students they serve and their relatively high per-pupil spending, increase the average expenditures.

Figure 7: Operating expenditures per pupil versus black and Hispanic enrollment by quintiles of Ohio school districts FY 2017
DI 7


In fact, districts with the highest percentage of black and Hispanic students spent on average $14,235 per pupil, while districts with the lowest percentage of black and Hispanic students spent $10,425.

It is worth noting that Quintile 5 represents districts that have 32 percent or more black and Hispanic students.

As this chart shows, Ohio’s funding system drives significantly more dollars to districts with higher numbers of those students.

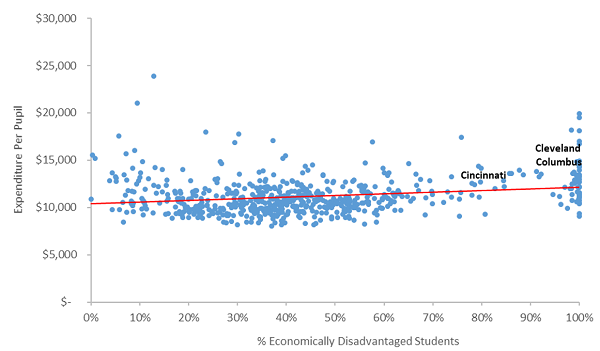
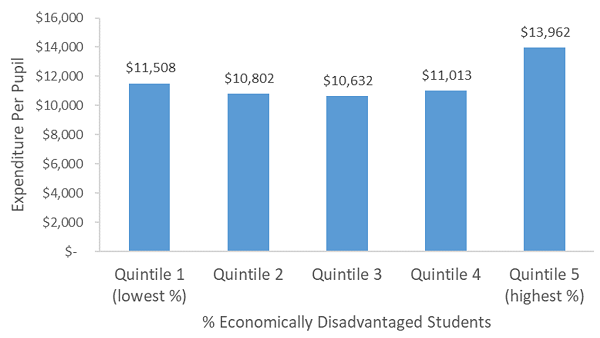
Figures 8 and 9 offer a similar analysis but for economically disadvantaged (ED) students. Figure 8 places the percentage of ED students on the horizontal axis instead of black and Hispanic students. The trend line is more or less flat. You will notice the number of districts between 30 and 50 percent ED below the trend line. These are mainly rural, lower spending districts. Districts at the far left and right sides of the chart (very low-poverty and very high-poverty, respectively) tend to spend more than those in the middle.

Figure 8: Operating expenditures per pupil versus economically disadvantaged enrollment in Ohio school districts FY 2017
DI 8

The cluster near 100 percent is due in large part to the Community Eligibility Program (CEP) that allows districts with high poverty to declare every student to be low-income—primarily for school lunch purposes.

Figure 9 shows that districts with a high percentage of economically disadvantaged students spend more than others.

Figure 9: Operating expenditures per pupil versus economically disadvantaged enrollment by quintiles of Ohio school districts FY 2017
DI 9

Figures 1 through 9 make it clear that black and Hispanic students in Ohio have lower academic achievement, on average, than their white peers. But in terms of funding, the picture is more nuanced. Although black and Hispanic students can benefit from additional supports, they already tend to be in districts with higher per-pupil funding amounts. This is not to say that black and Hispanic students receive “enough” funding, just that they receive more. There still is very much a lack of consensus on what constitutes “enough” when it comes to school funding, and whether spending more would help Ohio’s schools get better results.

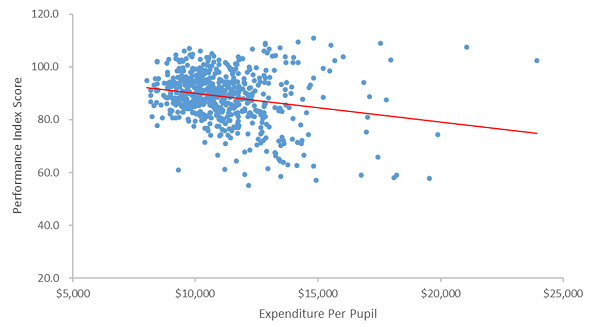
To start to get at these questions, Figure 10 compares academic achievement versus a district’s per-pupil expenditure. The achievement measure used on the vertical axis is Ohio’s performance index (PI). PI is a weighted measure of student proficiency on state test scores, calculated by ODE, and scores can range from 0 to 120. Per-pupil spending is on the horizontal axis.

Figure 10: Student achievement versus operating expenditure per pupil expenditures for Ohio school districts FY 2017
DI 10

This comparison attempts to illustrate the relationship—if there is any—between spending and academic achievement in Ohio. A common theory suggests that if the achievement gap is caused by a lack of adequate funding, these data might provide some evidence of that. If more spending indeed results in higher academic achievement, we would expect to see an upward trendline. But in Figure 10 we see that the line is actually slightly downward sloping. This doesn’t necessarily imply that more money causes lower achievement, but it does suggest that there isn’t a clear and obvious correlation between spending amounts and achievement levels.

Of course, the pattern in Figure 10 might be driven mostly by student demographics. Since we have already illustrated that districts with higher proportions of students of color, and low-income students, tend to spend more than others, it is possible that the negative relationship is driven by students’ background characteristics rather than funding per se.

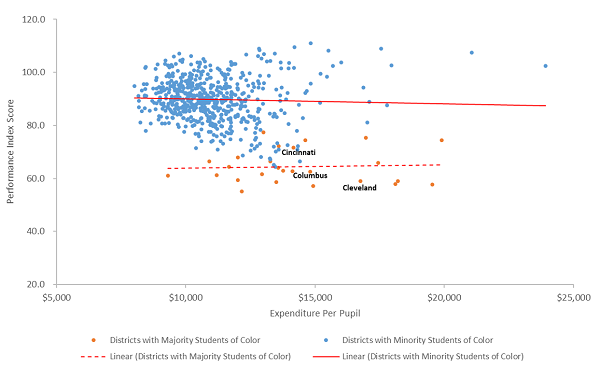
Figure 11 repeats the previous one but highlights—using orange circles—districts whose black and Hispanic student populations comprise 50 percent or more of its total enrollment. Now we can control for student demographics and look at the spending versus achievement relationship more directly.

Figure 11: Student achievement versus operating expenditure for Ohio districts serving 50 percent or more black and Hispanic students FY 2017
DI 11


The chart not only shows a graphic representation of the achievement gap—notice how the student achievement trend line is shifted lower—but it also demonstrates that the trend lines are flat for all districts. This indicates that student achievement doesn’t appear to increase in either cohort as per pupil funding increases.

Charter schools

Ohio’s robust charter school sector serves many black and Hispanic students, so its expenditure data is also relevant.

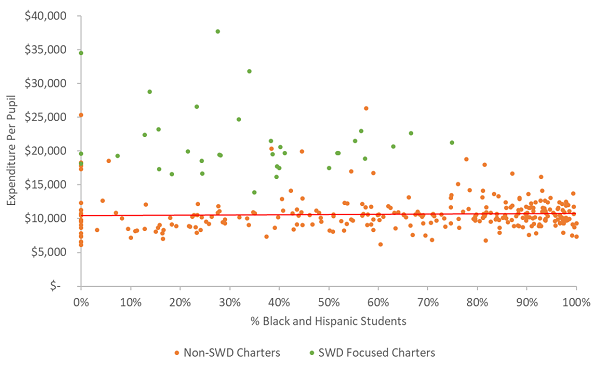
Figure 12 plots per-pupil expenditures in charter schools versus their percent of black and Hispanic enrollment. The data clearly show that most charters serve a majority of black and Hispanic students. These data are from ODE’s Advanced Reports, and mirror the district operational expenses used in previous charts.

Figure 12: Operating expenditure versus black and Hispanic enrollment for Ohio public charter schools FY 2017
DI 12

Distressingly, there is no clear relationship between spending and percentage of black and Hispanic enrollment in charters, which is far different than what we found in our earlier analysis of traditional public school districts.

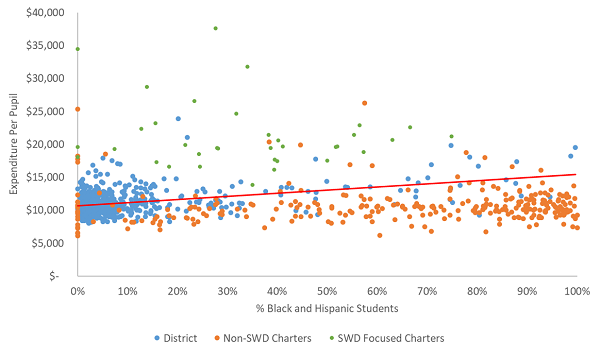
Finally, note the green dots. These are schools where more than 50 percent of pupils are students with disabilities. Schools such as these that focus on educating students with special needs are recognized as a distinct group under state law. As you’d expect, per-pupil funding is rightly much higher in these schools.

Figure 13 adds districts (blue dots) to the scatterplot of charters (orange dots) and charters that specialize in students with disabilities (green dots).

Figure 13: Operating expenditure versus black and Hispanic enrollment for Ohio districts and public charter schools FY 2017
DI 13

As you can see, charters are more likely to be in the bottom right part of the graph, indicating that they educate predominately black and Hispanic students but do not receive increased funding as a result.

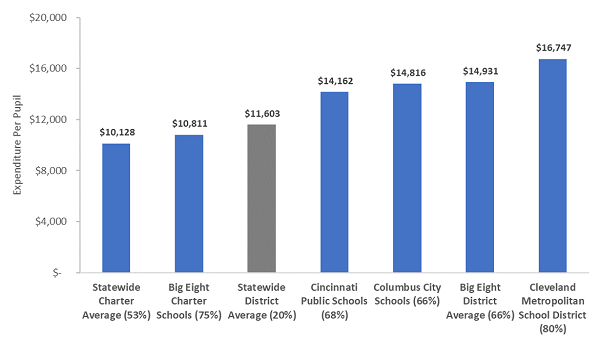
Figure 14 converts the scatterplot into a bar chart. In this case, it compares charter funding statewide, charter funding in the eight largest urban districts in Ohio, and funding in several specific urban districts. For context, the percentages of black and Hispanic students are displayed in parentheses under each bar.

Figure 14: Expenditures per pupil for Ohio charter schools and districts FY 17 (percentage of black and Hispanic students in parentheses)
DI 14

A couple of notes on the comparison in Figure 14:

  • All Big Eight charters are brick-and-mortar

  • Statewide charter average includes both online and brick-and-mortar

This analysis reveals a fairly significant gap in expenditures between charter and district schools serving similar students. Note that Big Eight charter schools spend less than districts statewide but enroll a much higher percentage of black and Hispanic students—75 percent to 20 percent.

Areas for improvement

There are some definite areas where we believe that Ohio’s school funding system could be improved to better serve all students, including minority pupils: 

  • Shift from providing a funding boost to students based on their free-or-reduced-price-lunch status to basing it on direct certification—a truer measure of poverty and student need that would drive more resources to the most disadvantaged students.

  • Eliminate funding caps. Columbus and Dayton school districts lost $100 million and $10 million, respectively, as a result of caps. If you have a formula, fund the formula.

  • Ensure charters receive funding that’s more on par with the districts whose students they serve.

Final thoughts

Achievement gaps between black and Hispanic students and their white peers are demonstrably real, and it’s imperative that we continue to find ways to increase minority achievement, whether through increased funding or some other means.

Spending among districts serving primarily black and Hispanic students is higher than most other districts. We should exercise caution when making school funding comparisons because many proponents of additional per-pupil funding cite a handful of small, high wealth suburban districts that outspend Ohio’s big-city districts. For example, Orange City School District in Cuyahoga County spends $24,000 per pupil. Beachwood City Schools, also in Cuyahoga County, spends $21,000 per pupil. And Indian Hill Exempted Village Schools in suburban Cincinnati spends $18,000 per pupil. They are largely outliers, and there is no reason to think they should be the floor for comparison purposes.  

And finally, public charter schools are serving a large percentage of Ohio’s black and Hispanic students. Yet they are significantly underfunded relative to similar districts.

I appreciate the opportunity to provide testimony to you today and commend you for digging into this very important issue.


view

Tackling Ohio’s toughest education challenges: Create a curriculum-review committee

Ohio Education Gadfly
10.8.2018
Ohio Gadfly Daily

Editor’s Note: As Ohioans prepare to elect a new governor this November, and as state leaders look to build upon past education successes, we at the Fordham Institute are developing a set of policy proposals that we believe can lead to increased achievement and greater opportunities for Ohio students. This is the third in our series, under the umbrella of supporting great educators. You can access all of the entries in the series to date here.


Proposal: Form an independent review committee at ODE that evaluates the quality of curricular textbooks and materials. These evaluations would help to inform districts’ purchasing and instructional decisions, but districts would not be required to adopt or implement any particular curriculum, textbook, or learning material.


Background: Smart, hardworking teachers are a critical part of the school-quality equation, but so too are the curricula deployed in their classrooms. Studies from California, Florida, and Indiana all indicate that curricular decisions—referring to the textbooks and materials that schools deploy—make a difference in student learning. These studies also find that high-quality materials seldom cost more than mediocre ones, suggesting that curricular reform could be a cost-efficient way to boost learning. However, surveys find that educators often struggle to identify which resources are most likely to boost achievement. This isn’t surprising, given limited planning time, as well as an increasingly crowded marketplace for educational products, both digital and in print. Several efforts have been undertaken to help educators better discern quality materials. For example, EdReports, an independent nonprofit, evaluates math and ELA textbooks based on alignment to college-and-career-ready standards. Louisiana undertook its own evaluations—carried out by veteran teachers—that aimed to inform schools’ curricular decisions. Ohio does not have a central process for adopting textbooks or materials—under state law, local districts and schools make those decisions—nor does it have a review or rating process for curricular materials, à la Louisiana. Although Ohio’s decentralized approach ensures local control over curriculum, it also leaves educators without clear, impartial information that can guide decisions on curriculum.


Proposal rationale: High-quality instructional materials, properly deployed, benefit students at little additional cost to schools. By creating a system to evaluate materials—but not requiring their use—Ohio would both provide important information that can sharpen educators’ decision making, while maintaining local autonomy over curricular decisions. To incentivize the use of high-quality textbooks and materials, the state could begin to offer quality materials at a discount, something that Louisiana has done.


Cost: Though exact costs are indeterminate, allocating an additional $5 to $10 million per year to support a review team that evaluates curriculum and periodically updates those evaluations as new materials come to market would likely achieve the desired goal. The funds would be used for administrative expenses and to create an online tool through which educators can access reviews and ratings. Once evaluations are completed, Ohio could then offer materials and textbooks deemed high quality to districts at a discount.


Resources: For a broad summary of curriculum research, see David Steiner’s report Curriculum Research: What We Know and Where We Need to Go, published by Standards Work (2017); for a study from California on math textbooks, see Cory Koedel and Morgan Polikoff’s article “Bang for Just a Few Bucks: The Impact of Math Textbooks in California,” published by the Brookings Institution (2017); and for more on Louisiana’s curricular efforts, see Robert Pondiscio’s 2017 article “Louisiana Threads the Needle on Ed Reform,” published in Education Next. EdReports’ reviews are available on its website.

view

Pathway to Success: Menlo Park Academy gives gifted children a unique space where they can thrive

9.26.2018
Report

In Ohio today, approximately 250,000 students—rich and poor alike—are formally identified as gifted. These “high flyers” have tremendous potential to become the entrepreneurs, scientists, and engineers, as well as the civic and cultural leaders of the future. Yet all too often, they sit in one-size-fits all classrooms, bored with material they already know and held back by a system that too rarely challenges them. Our latest charter public school profile is a look at Menlo Park Academy in Cleveland, a school designed to uniquely support gifted students.

We believe that this look at Menlo Park—and the success of students Cael and Teagan—will show that creating specialized schools for gifted students can be done and that the charter public school model is perfectly suited for such a task.

view

Do private schools avoid voucher programs because of excessive regulation?

Jeff Murray
10.3.2018
Flypaper

The demand side of voucher programs is often studied, as are student outcomes. Far less analyzed is the supply side of the equation—why private schools do or don’t participate in publicly funded voucher programs. A recent analysis released by the Cato Institute looks to redress that balance. Unfortunately, the effort founders due to the limitations of the study design.

Researchers Corey DeAngelis and Blake Hoarty sensibly theorize that when the costs of participation (increased regulation imposed on schools by the state) outweigh the benefits of greater enrollment and more revenue, private schools will opt not to participate. That is, they’ll refuse to accept voucher students. The researchers further theorize that lower-quality schools will have more incentive to participate due to the need for funding and will more readily accept regulation in order to gain the additional funding. If true, this would tend to reduce access to high quality educational options rather than expanding access.

DeAngelis and Hoarty reviewed two voucher programs: the Milwaukee Parental Choice Program (MPCP) and Ohio’s Educational Choice Scholarship Program (EdChoice). These were chosen because they are two of three such programs with the highest regulatory burden upon them, according to a Fordham-sponsored report published in 2013. To test the school-quality theory, DeAngelis and Hoarty used four data sources—tuition rate, enrollment, and two different online review scores—as proxies for school quality. The higher the tuition, enrollment, and customer scores on Google and GreatSchools, the better the school was determined to be and the less likely the school should be to participate in the voucher program.

The researchers found that a $1,000 increase in tuition was associated with a 3 percent lower likelihood of participation in MPCP and a 3.8 percent lower likelihood of participation in EdChoice. However, school enrollment level was not found to significantly affect likelihood of participation in either program. Likewise, while a one-point increase in a GreatSchools review score was associated with a 14.8 percent reduction in the likelihood of participation in MPCP and a 17.8 percent reduction in the likelihood of participation in EdChoice, Google review scores were not found to significantly affect likelihood of participation in either program. From these findings, DeAngelis and Hoarty conclude that their theory—that lower-quality schools are more willing to put up with the regulatory burden in exchange for access to additional money—is “the strongest theory currently available” that fits the correlational connection in the data.

And herein lies the limitation of this analysis: the existence of strong yet untestable alternative theories.

DeAngelis and Hoarty note that the average private school in the samples from both Google and GreatSchools were less than one point away from the maximum possible rating, indicating that most schools—whether voucher participants or not—are clustered at or near the top of the scale. While the lowest-rated schools may be the most likely to participate, these are largely outliers. Another strong theory would posit that, since all such ratings systems are subjective, ratings could be dragged down or up based on a host of non-academic criteria, such as lunch programs, extracurricular activities, neighborhood location, and bus transportation. Additionally, the researchers note that such open source ratings could suffer from bias introduced by ratings from non-customers. However, a far more in-depth analysis would be required to test this theory. Meanwhile, school enrollment level—not susceptible to such bias and likely a more robust marker of school quality in states with robust school choice environments—is shown not to significantly affect participation decisions. We accept the testable over the non-testable theory at our peril.

The notion of regulation of private schools within voucher programs is similarly problematic. Despite ranking first and third on the Fordham report’s overall scale of “regulatory burden,” MPCP and EdChoice varied greatly in the various domains classified as burdens. Indeed, of the seven specific areas of regulation listed for MPCP by DeAngelis and Hoarty, EdChoice shares only two of them. Private schools in Ohio have a long history of state support. Since the 1960s, students attending private school have been provided state funded transportation, or parental payment in lieu of transportation, followed in the 1970s by assistance to schools to purchase secular textbooks and curricular materials, and in the 1980s by reimbursements for hiring psychologists and therapists, among many other administrative expenses. In exchange for this largesse, amounting to over $206 million in 2016, or more than $1,000 per pupil, private schools in Ohio have voluntarily agreed to more oversight by the state than is typical elsewhere. The increased regulatory “burden” upon Ohio’s private schools for accepting students with vouchers is negligible and is part and parcel of the strong relationship between the state and those schools, which long predates EdChoice and includes private school voucher participants and non-participants alike.

Additionally, the topic of student eligibility is treated too generally in the analysis. It makes sense to assume that most private schools in Milwaukee would be within reasonable travel distance for all eligible students—pegged at 69 percent of the student body. However, there are parts of Ohio in which the eligibility rate is 100 percent and other parts in which the eligibility rate is zero. If there are no eligible students within reasonable travel distance of a highly-rated private school, it will be a non-participant whether or not the leadership wants to participate. The supply of eligible students is a direct determining factor in private schools’ choice to participate not accounted for in the Ohio analysis. That is not tested here, although it could have been.

Finally, the one variable that would likely have the most direct effect on a private school’s participation decision is the amount of money voucher bring in. It is not analyzed here because there is no experimental comparison to be made. The average voucher funding amount for MPCP is $7,503 per student, approximately 65 percent of the average public school per pupil funding level in Milwaukee. The average voucher funding amount for EdChoice is a mere $4,705, approximately 37 percent of the average public school per pupil funding level in Ohio. These are paltry amounts compared to average tuition costs and once again call into question whether private schools are really in the voucher game for the money. What would be the effect of raising voucher amounts by increments of $1,000 on school participation? Impossible to tell without a state doing just that, but there is clearly room for Wisconsin and Ohio to raise voucher amounts while still maintaining a net savings for education spending in each state. In Ohio, the lowest-performing school districts—where a majority of voucher-eligible students live—typically receive per-pupil funding well in excess of the state average, leaving even more room for voucher funding levels to rise. That would be an experiment worth doing.

In the end, DeAngelis and Hoarty are right only in their basic assumption: that participation decisions for private schools are based on a balance of benefits versus costs. While they assert that excessive regulation is the “strongest theory currently available” to explain the observed levels of private school participation in MPCP and EdChoice, real world details are too lacking on both the benefits and the costs to truly rule out any of a number of other theories.

SOURCE: Corey A. DeAngelis and Blake Hoarty, “Who Participates? An Analysis of School Participation Decisions in Two Voucher Programs in the United States,” CATO Institute (September, 2018).

Fordham Logo

© 2026 The Thomas B. Fordham Institute
Privacy Policy
Usage Agreement

National

P.O. Box 110
Burke, VA 22009

202.223.5452

[email protected]

Ohio

P.O. Box 82291
Columbus, OH 43202

614.223.1580

[email protected]

Sponsorship

130 West Second Street, Suite 410
Dayton, Ohio 45402

937.227.3368

[email protected]