Mobile Navigation

  • National
    • Policy
      • High Expectations
      • Quality Choices
      • Personalized Pathways
    • Research
    • Commentary
      • Gadfly Newsletter
      • Flypaper Blog
    • Events
    • Scholars Program
  • Ohio
    • Policy
      • Priorities
      • Media & Testimony
    • Research
    • Commentary
      • Ohio Education Gadfly Biweekly
      • Ohio Gadfly Daily
  • Charter Authorizing
    • Application
    • Sponsored Schools
    • Resources
  • About
    • Mission
    • Board
    • Staff
    • Career
Home
Home
Advancing Educational Excellence

Main Navigation

  • National
  • Ohio
  • Charter Authorizing
  • About

Ohio Menu

  • Topics
    • Accountability & Testing
    • Advanced Education
    • Career & Technical Education
    • Charter Schools
    • Curriculum & Instruction
    • ESSA
    • Evidence-Based Learning
    • Governance
    • Personalized Learning
    • Private School Choice
    • School Finance
    • Standards
    • Teachers & School Leaders
  • Research
  • Policy
  • Commentary
    • Ohio Gadfly Newsletter
    • Ohio Gadfly Blog
    • Events

The Education Gadfly Weekly

Sign Up to Receive Fordham Updates

We'll send you quality research, commentary, analysis, and news on the education issues you care about.
Thank you for signing up!
Please check your email to confirm the subscription.

Ohio Education Gadfly Biweekly Volume 10, Number 20

Volume 10, Number 20
9.29.2016
9.29.2016

Ohio Education Gadfly Biweekly Volume 10, Number 20

Volume 10, Number 20
view
Standards & Accountability

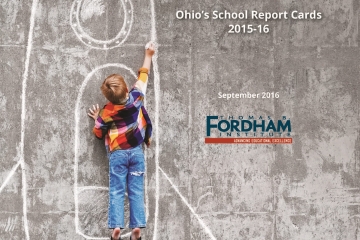
Setting Sights on Excellence: Ohio’s School Report Cards, 2015-16

On September 15, Ohio released report cards for approximately 600 school districts and 3,500 public schools (district and charter). These report cards are based on state exam results from the 2015-16 school year, along with several other gauges of student success.

Aaron Churchill 9.29.2016
OhioReport

Setting Sights on Excellence: Ohio’s School Report Cards, 2015-16

9.29.2016
Report

Introduction to Setting Sights on Excellence - Fordham's analysis of Ohio’s 2015-16 school report cards

Aaron Churchill
9.29.2016
Blog

The ongoing problem of chronic absenteeism

Jessica Poiner
10.4.2016
Blog

Teachers' Labor Market Responses to Performance Evaluation Reform: Experimental Evidence from Chicago Public Schools

Jessica Poiner
10.6.2016
Blog

How race consciousness, multiculturalism, and international travel shaped a young gifted Black girl

10.4.2016
The High Flyer

Telling a deeper story about student success in Cleveland

10.7.2016
Blog

2016 Citizen-Readiness Index

Jamie Davies O'Leary
10.7.2016
Blog
view

Introduction to Setting Sights on Excellence - Fordham's analysis of Ohio’s 2015-16 school report cards

Aaron Churchill 9.29.2016
Blog
view

The ongoing problem of chronic absenteeism

Jessica Poiner 10.4.2016
Blog
view

Teachers' Labor Market Responses to Performance Evaluation Reform: Experimental Evidence from Chicago Public Schools

Jessica Poiner 10.6.2016
Blog
view

How race consciousness, multiculturalism, and international travel shaped a young gifted Black girl

10.4.2016
The High Flyer
view

Telling a deeper story about student success in Cleveland

10.7.2016
Blog
view

2016 Citizen-Readiness Index

Jamie Davies O'Leary 10.7.2016
Blog
view

Setting Sights on Excellence: Ohio’s School Report Cards, 2015-16

9.29.2016
Report

On September 15, Ohio released report cards for approximately 600 school districts and 3,500 public schools (district and charter). These report cards are based on state exam results from the 2015-16 school year, along with several other gauges of student success. This year’s report card analysis, Setting Sights on Excellence, offers a close look at the report card data while also placing them within the context of Ohio’s major policy reforms. With the aim of readying more students for college and career, such reforms include a shift to higher learning standards and more rigorous state assessments. 

The key findings:

  • Reflecting Ohio’s higher learning standards, fewer students in Ohio are deemed “proficient” on state exams than in previous years. In 2015-16, roughly 55 to 65 percent of Ohio pupils met the proficiency bar in the core subjects. Nevertheless, Ohio’s proficiency benchmark still falls short of matching a rigorous, college and career ready standard.
  • In turn, school ratings across that state have declined. In urban areas, public schools receive almost universally low ratings on proficiency based metrics: On the state’s performance index—a key gauge of student achievement—94 percent of urban schools received D or F ratings in 2015-16. This reflects both higher standards and the persistent achievement gaps between disadvantaged pupils and their peers.
  • Ohio’s urban schools, however, can perform well on the value added measure—a gauge of student growth that is not correlated with demographics. In 2015-16, 29 percent of urban charter schools received an A or B rating on value added, while 19 percent of district-run schools did so. This report recognizes twenty-five high-performing urban schools that have earned strong value added results over the past three years.

In addition to analyses of statewide data, Setting Sights on Excellence provides an in-depth look at the performance of charter and district sectors in the Ohio Big Eight cities (Akron, Canton, Cincinnati, Cleveland, Columbus, Dayton, Toledo, and Youngstown). Download the report today to learn more about Ohio’s report cards.

view

Introduction to Setting Sights on Excellence - Fordham's analysis of Ohio’s 2015-16 school report cards

Aaron Churchill
9.29.2016
Blog

Management expert Peter Drucker once defined leadership as “lifting a person's vision to higher sights.” Ohio has set its policy sights on loftier goals for all K-12 students in the form of more demanding expectations for what they should know and be able to do by the end of each grade en route to college and career readiness. That’s the plan, anyway.

These higher academic standards include the Common Core in math and English language arts along with new standards for science and social studies. (Together, these are known as Ohio’s New Learning Standards.) Aligning with these more rigorous expectations, the state has implemented new assessments designed to gauge whether students are meeting the academic milestones important to success after high school. In 2014-15, Ohio replaced its old state exams with the PARCC assessments and in 2015-16, the state transitioned to exams developed jointly by the American Institutes for Research (AIR) and the Ohio Department of Education.

As the state marches toward higher standards and—one hopes—stronger pupil achievement and school performance, Ohioans are also seeing changes in the way the state reports student achievement and rates its approximately 600 districts and 3,500 public schools. Consider these developments:

As the standards grow more rigorous, pupil proficiency rates have declined. As recently as 2013-14, Ohio would regularly deem more than 80 percent of its students to be “proficient” in core subjects. But these statistics vastly overstated the number of pupils who were mastering math and English content and skills. For instance, the National Assessment of Educational Progress—the “nation’s report card”—indicates that just two in five Ohio students meet its stringent standards for proficiency. According to ACT, barely one in three Buckeye pupils reaches all of its college-ready benchmarks. The Ohio Department of Higher Education’s most recent statistics find that 32 percent of college-going freshman require remediation in either math or English. But with the implementation of higher standards and new exams, the state now reports more honest proficiency statistics: in 2015-16, roughly 55 to 65 percent of students statewide met Ohio’s proficient standard depending on the grade and subject. Although these rates still overstate the fraction of students meeting a college and career ready standard, parents and taxpayers are gaining a truer picture of how many young people meet a high achievement bar.

Higher achievement standards have also meant lower school ratings, particularly on the state’s performance index. This key report card component is a measure of overall student achievement within a school and one that is closely related to proficiency rates (and, for better and worse, closely correlated with socio-economics). While lower performance index scores affect schools throughout Ohio, they create special challenges when examining the results of high-poverty urban schools. Under softer standards, a fair number of urban schools maintained a C or higher rating on this measure, but now almost all of them receive a D or F performance index rating. In 2015-16, a lamentable 94 percent of urban schools were assigned one of those low grades. (High-poverty schools also receive near-universal Ds and Fs on a couple other proficiency-based measures.) Because PI ratings yield so little differentiation, policy makers, analysts, and the media need to use extra care lest they label virtually every urban school poor performing. Student achievement is indeed low in high-poverty communities and we all want to see stronger outcomes for disadvantaged children. But by concentrating on proficiency-based measures, we risk calling some schools failures when they are actually helping their students make up academic ground.

That’s where Ohio’s “value added” rating kicks in. This measure utilizes student-level data and statistical methods to capture the growth that students make (or don’t make) regardless of where they begin on the achievement spectrum. Because value added methods focus on pupil growth instead of point-in-time snapshots of proficiency, they can break the link between demographics and schools’ outcomes as measured strictly by achievement. On value added, urban schools can and do perform as well (or as poorly) as their counterparts from posh suburbs. In the present report, we show that 22 percent of Big Eight public schools earned an A or B on the state’s value added measure in 2015-16. Given the criticism of Buckeye charter schools, it is even more notable that a greater proportion of urban charters earned A or B value added ratings than did their Big Eight[1] district counterparts (29 to 19 percent). Although the evidence is based on just one year of results, one hopes that these results represent the onset of an era of higher charter performance after major reforms were enacted in 2015.

While value added scores haven’t noticeably plummeted or inflated with the rising standards, we should point out some important developments in the measure itself. First, during Ohio’s testing transitions, the state has reported value added results based on one-year calculations rather than multi-year averages, as was done prior to 2014-15. Probably as a result, some schools’ ratings have swung significantly; for example, Dayton Public Schools received an F on value added in 2014-15 but an A in 2015-16. One year of value added results can’t perfectly capture school performance—we need to take into account a longer track record on this report card measure.

Second, Ohio’s value added system now includes high schools. Previous value added ratings were based solely on tests from grades four through eight (third grade assessments form the baseline). With the phase out of the Ohio Graduation Tests (OGT) and the transition to high school end-of-course exams, Ohio has been able to expand value added to high schools. (The OGTs were not aligned to grade-level standards, prohibiting growth calculations; EOCs are aligned to the state’s new learning standards.) Starting in 2015-16, the state assigns value added ratings at the high school level (though it reported high school results in the year prior). In the absence of value added, analysts were limited to proficiency or graduation rates that can disadvantage high-poverty high schools. With the addition of value added, we gain a richer view of high school performance.

Shifting to higher learning standards, transitioning to new tests, and evolving to more comprehensive school report cards has led to some frustration. To a certain degree, the feedback is understandable—it has been a challenging start in the long journey toward academic excellence. In the days ahead, Ohioans should absolutely continue to work together to make sure state standards and accountability policies are as rigorous, coherent, and fair as possible. At the same time, the state should ensure continuity in key policy areas so that we can gauge our progress moving forward.

At the end of the day, we should keep the big picture in mind: High standards, properly implemented, help form the foundation for greater student achievement. Several Ohio school leaders appear ready and willing to tackle these challenges. After the report card release, David Taylor, a leader at Dayton Early College Academy, told the Dayton Daily News, “We hope that people have the patience to understand that the goal posts moved…We’re asking a lot more of our kids and their families. That will require patience and a plan.” On the pages of the same newspaper, Scott Inskeep, superintendent of Kettering City Schools, said, “The AIR assessments were tough…We have to get tough, ourselves, and teach to the depth that is needed to assure student success on these tests.” Ohio has charted a more rugged course for its students and schools. If state and local leaders can maintain this course—setting sights on excellence—we should begin to see more young people fully prepared to face the challenges of tomorrow.

Download the full report here.


[1] The Big Eight cities are Akron, Canton, Cincinnati, Cleveland, Columbus, Dayton, Toledo, and Youngstown.

view

The ongoing problem of chronic absenteeism

Jessica Poiner
10.4.2016
Blog

According to the most recent Civil Rights Data Collection (CRDC) compiled by the U.S. Department of Education,[1] an alarming 6.5 million American students, more than 13 percent nationwide, were chronically absent—defined as missing 15 or more days of school— during the 2013-14 school year. Of these students, more than half are enrolled in elementary school, where truancy can contribute to weaker math and reading skills that persist into later grades. Chronic absenteeism rates are higher in high school: Nearly 20 percent of U.S. high school students are chronically absent, and these teenagers often experience future problems with employment, including lower-status occupations, less stable career patterns, higher unemployment rates, and low earnings.  

The data get even more disconcerting when they’re disaggregated by location. The CRDC explains that nearly 500 school districts reported that 30 percent or more of their students missed at least three weeks of school during the 2013-14 school year. The idea that certain districts struggle more with chronic absenteeism than others caught the attention of Attendance Works (AW), an organization that aims to improve school attendance policies. To create a more in-depth picture of the problem, Attendance Works combined the CRDC data with statistics from the Census Bureau and the National Center for Education Statistics and released a report with a stunning key finding: Half of the nation’s chronically absent students are concentrated in just 4 percent of districts.[2]

These 654 districts are located throughout 47 states and Washington D.C. and include cities, suburbs, towns, and rural areas. AW pays particular attention to two groupings within the 4 percent. The first is a group of large, mostly suburban districts with large numbers of chronically absent students; districts like Fairfax County, Virginia (12 percent of more than 180,000 students are chronically absent) and Montgomery County, Maryland (16 percent of more than 150,000 students are chronically absent), which are known for academic achievement but also their growing low-income populations. The second grouping is composed of “urban school districts with large populations of minority students living in poverty.” AW notes that half the urban districts with high numbers of chronically absent students are highly segregated by race and income: “At least 79 percent of the students in these districts are minority, and at least 28 percent of the children between ages 5 and 17 live in poverty.”

So how did Ohio fare on the AW report? During the 2013-14 school year, the Buckeye State had nearly 1.8 million students. 265,086 students (15 percent) were chronically absent—right around the national average. To illustrate their findings, Attendance Works developed interactive maps. Here’s a look at which Ohio districts hold a spot on one of the maps, in order from the highest percentage of chronically absent students to the lowest:

[[{"fid":"117263","view_mode":"default","fields":{"format":"default"},"type":"media","attributes":{"style":"width: 650px; height: 413px;","class":"media-element file-default"},"link_text":null}]]

It’s no surprise to see Cleveland with the highest percentage of chronically absent students: CEO Eric Gordon told the Plain Dealer in 2015 that over the previous three years, the district had averaged 57 percent of kids missing ten days or more in a year.

Attendance Works offers a list of six steps for states and districts to take in order to use the data to create an effective action plan. Each step has a variety of additional recommendations, such as adopting a multi-tiered system of support that addresses common attendance barriers and includes interventions like home visits and personalized outreach, developing tailored action plans, and mentoring.

The good news for Ohio is that many of these recommendations are already being considered. House Bill 410, which was introduced back in December 2015, is a common sense bill that aims to tackle the punitive roots of and the lack of clear and consistent data on student truancy in the Buckeye State. (See here for an in depth overview of the bill.) Unfortunately, the bill has yet to make it out of the Senate.

Recently, some Ohio education groups voiced concerns that many schools lack the required personnel and finances to properly support the absence intervention teams outlined in the bill. (These teams are responsible for developing an intervention plan tailored specifically to the student, with the aim of getting her back to—and keeping her in—school. Teams must include a district administrator, a teacher, and the student’s parent or guardian, and are required to meet certain deadlines.) They also questioned the “extensive reporting” the bill calls for. Given the heavy load of responsibilities that teachers and administrators already have, it would be wise for legislators to seek feedback about how to make absence intervention teams more workable without losing sight of their intended purpose. The same is true for reporting requirements, which could be streamlined but not erased completely.

There’s a growing sense that when lawmakers return to Columbus this fall, they will fine tune and then pass House Bill 410. That’s a good thing. Improving the data systems and intervention protocols for chronic absenteeism is low-hanging fruit, and the General Assembly should do its part to ensure that fruit is harvested and solid policies around student attendance are in place.


[1] The U.S. Department of Education’s Office of Civil Rights, which conducts the CRDC, notes that their data may differ from those of other published reports due to “certain data decisions.” Find out more here.

[2] Like the USDOE, Attendance Works notes that some of their data are incomplete because of data corrections and submission errors. The authors of the study do not believe these issues change the overall patterns they reported.

view

Teachers' Labor Market Responses to Performance Evaluation Reform: Experimental Evidence from Chicago Public Schools

Jessica Poiner
10.6.2016
Blog

A multitude of research has shown that quality teaching is necessary for students’ achievement and positive labor market outcomes. Rigorous evaluations have been hailed as a way to improve the teacher workforce by recognizing and rewarding excellence, providing detailed and ongoing feedback to improve practice, and identifying low-performers who should be let go. While plenty of time has been devoted to how best to provide teachers with feedback, less time has been spent examining how evaluation systems contribute to the removal of underperforming teachers and the resulting changes in the teacher workforce.   

This study examines The Excellence in Teaching Project (EITP), a teacher evaluation system piloted in Chicago Public Schools (CPS) in 2008. The program focused solely on classroom observations and used Charlotte Danielson’s Framework for Teaching (FFT) as the basis for evaluation (unlike many current systems, which rely on multiple measures including student test scores). Roughly nine percent of all CPS elementary teachers participated in the first year of the pilot, which was considered a “low-stakes intervention” since scores on the FFT rubric were not officially included on teachers’ summative evaluation ratings.

Prior to the use of the FFT, teachers in Chicago were evaluated against a rudimentary checklist of classroom practices. This overly-generous model led to nearly all CPS teachers (approximately 93 percent) receiving one of the top-two ratings in a four-tiered rating system. EITP, on the other hand, utilized the detailed, research-based set of components of the FFT and required teachers to be evaluated multiple times a year. Principals were trained extensively on how to effectively use the framework, and were required to have conferences with teachers before and after observations. Because FFT provided teachers and principals with far more detailed information about instructional performance than the previous system, the framework produced more variation in teacher ratings.

The pilot started with forty-four randomly selected elementary schools in 2008-09; the following year forty-nine schools were added. CPS worked with the University of Chicago Consortium on School Research to craft an experimental design for implementation, and the University of Chicago randomized schools to take part in the first and second cohorts. Both treatment and control schools were statistically indistinguishable in regards to prior test scores (reading and math) and student composition.

Despite the fact that the experimental design was only maintained for one year, researchers were able to determine how the pilot impacted teacher turnover. While there was no average effect on teacher exits, the researchers did find that teachers who had low prior evaluation ratings were more likely to leave the district due to the evaluation pilot. In fact, by the end of the first year of implementation, 23.4 percent of low-rated teachers in schools using the EITP pilot left the district, compared to 13 percent of low-rated teachers in control schools.[1] Non-tenured teachers were also “significantly more likely” to leave. Overall, the first year of the pilot saw an 80 percent increase in the exit rate of the lowest performing teachers and a 46 percent increase in the turnover of non-tenured teachers.[2] The loss of teachers who were both low-performing and non-tenured suggests that “contract protections enjoyed by tenured teachers provided meaningful job security for those who were low-performing,” as there was no difference in the exit of low-rated tenured teachers. Also worth noting is that teachers who remained in EITP schools were higher-performing than those who exited, as were the teachers who replaced exiting educators.

These findings suggest two important conclusions. First, teacher evaluation reforms like the EITP pilot can indeed impact the quality of the teacher workforce by inducing the exit of low-performers. In turn, by replacing low-performing teachers with higher-performing ones, achievement should in theory rise  (though the researchers did not specifically test this hypothesis). Second, given that low-rated non-tenured teachers were significantly more likely to leave than low-rated tenured teachers, the researchers were able to surmise that “tenure reform may be necessary to induce low-performing tenured teachers to leave the profession.”

SOURCE: Lauren Sartain and Matthew P. Steinberg, “Teachers' Labor Market Responses to Performance Evaluation Reform: Experimental Evidence from Chicago Public Schools,” The Journal of Human Resources, (August 2016).


[1] The researchers note that although “the leave rate of low-rated treatment school teachers is imprecisely estimated because very few teachers received low ratings, it is remarkably stable and large in magnitude.”

[2] In CPS, teachers who are in their first, second, and third year of teaching are non-tenured.

view

How race consciousness, multiculturalism, and international travel shaped a young gifted Black girl

10.4.2016
The High Flyer

“No one is born fully-formed: it is through self-experience in the world that we become what we are.” - Paulo Freire

As a child, I always had a sense of myself—a way of understanding who I was/am, in a very concrete and tangible way. When I was a young girl others would often comment that I appeared very grounded and steady. At the time I didn't quite know what they meant because I was usually in my own internal world and not really aware of how others viewed me. But I do remember as a child feeling connected to my familial roots and having a deep perception of and sensitivity to my physical, mental, and spiritual existence. That is what knowledge of self meant to me. And that knowledge—expanded in a decidedly global way—would eventually become my foundation for navigating the world as a gifted child and young woman.

Reflecting on my childhood and upbringing, I can see clearly that my parents already had their own plans to make sure I received an extraordinary education at school and at home. They were committed to having me educated in the public schools, but they certainly did not intend to leave the trajectory of my education and fate of my future to others. They were active in shaping how my schools and teachers would interact with me, starting with advocating for me to be placed in the gifted program—called the Mentally Gifted (MG) program in our school district.

Everything we did in MG seemed to dovetail seamlessly with my parents' vision and efforts to educate me. I frequently took weekend trips with my mom or dad to art exhibitions or the local horticultural center. I helped my grandmother in her community garden and with her homemade soap-making business. I attended graduate classes individually with both of my parents. I took piano music lessons with my uncle who was a trained music teacher and drove with family friends to New York where I saw ballets (including the famed Cuban ballet) and Broadway plays and sampled different cuisines such as Japanese tempura and Indian daal. I was beginning to see myself as truly of and in the world at large. In Beloved, Toni Morrison once wrote, regarding the character Baby Sugg:

And no matter, for the sadness was at her center, the desolated center where the self that was no self made its home…fact was she know more about them than she knew about herself, having never had the map to discover what she was like.

This passage has resonated with me for years. It is as if my parents once said to each other, “No. Our Nicole is going to know herself. She has to have a map to discover what she is like.”

Young, Gifted, and Black – Developing Race Consciousness

Self-identifying as a smart and gifted Black girl was beginning to be etched into my psyche and internalized as part of my core identity. That was a good thing—because very soon I would face what seems to be a rite of passage for smart Black kids—bullying and teasing for being different or "acting white.” I did not get teased as badly as a few other students, but I was targeted enough to know I didn’t want or enjoy this kind of attention. Taking public transportation to and from school exposed me to some of the ills from which my parents were trying to shield me. Sexualized cat calls from grown men who viewed young girls as fair game for their lustful desires and incessant teasing from other neighborhood children who didn’t know what to make of a shy girl walking alone from the bus stop carrying a large backpack and violin case were part of my indoctrination into the harsh realities of an urban America shaped by persistent structural racism and sexism.

Part of my buffer was a firm sense of self and race consciousness—an understanding of myself as a young Black girl from a legacy of rich history and beauty and knowledge of the social realities of racial inequality. Race consciousness helped to inoculate me from others’ overt bigotry and internalized self-hatred. My ideas about the world were bigger and more complex. Sneers from racists and taunts from peers were not erased, but those incidents took a backseat to my own evolving map of myself.

Going Global

In the same way that Venus and Serena Williams's parents devised and carried out a plan to raise tennis stars, my parents and family were very strategic about raising a gifted child who would be engaged and immersed in the world at large. Instead of weekly sports lessons, my parents exposed me to constant critical analysis of current events, community activism, global citizenship, and multicultural appreciation.

My family always talked to and about me through an international lens—as a citizen of the world. I remember my dad telling me about his travels throughout Africa and South America as part of his political organizing work. I remember my mom recounting stories of traveling to the World Youth Festival in Germany while she was seven months pregnant with me. When I was still a small girl, my grandmother had long-term visitors from Zimbabwe and London (a “Black Brit” as our guest called herself) staying at her house, exposing me to diversity in a way that no books or school curricula could come close to doing.

The height of this emphasis on internationalism came when my dad announced that he and my mom had signed me up for an international children’s camp in Russia. “Russia! Why?” I thought. I was afraid when they told me I was going to take a plane from New York to Moscow with a group of children who also had activist parents. I worried that the plane would be hijacked or, worse, that my friends would think I was a weirdo for having parents that would send me to such a far-off place that either they had never heard of or had heard of only as the heart of “evil communism.” But off I went. I stayed for five weeks and traveled throughout the country interacting with children literally from all over the world.

As scary as the trip was initially, it ended up being one of the formative and most influential experiences of my young life. I learned in firsthand detail about Apartheid in South Africa and the civil war in Nicaragua. I encountered the vast diversity of African peoples and cultures when I met kids from Ethiopia, Nigeria, Algeria, and Guinea. I was also confronted with the nasty underbelly of racial stereotyping by a couple of fellow American camp goers. Through that unfortunate incident I learned a valuable lesson in how to exude confidence and navigate others’ ignorance and arrogance. I returned home right before I started high school. I transitioned easily into honors and eventually AP classes at my prestigious all-girls high school. My understated confidence and self-awareness also helped me to flourish socially and emotionally (as much as could be expected for a teen girl!).

I knew early on that I would eventually pursue and attain a Ph.D. in psychology. I also had an unconscious understanding that international travel and living would play an important role in my career development. To that end, I traveled to Cuba while I was in graduate school and gained invaluable insights into race, racism, and anti-racism; I was part of the first group of students in my clinical psychology Ph.D. program that participated in an international internship in Grenada, West Indies; and I even carved out a little time during graduate school to travel to Guinea, West Africa, and Japan to study and perform with different African dance groups.

Then, to no one’s surprise, but many people’s confusion, I applied for a prestigious fellowship to conduct my dissertation research in Ethiopia. While living in Ethiopia, I traveled all over the country and to neighboring Sudan and nearby Egypt by myself. Everyone at home thought I was nuts and worried that I was going alone to chaotic and possibly terrorist states. I laughed at the idea, thinking how they were missing out on the elaborate weddings and tea parties I was enjoying in North Africa. Later, as a professional psychologist, I became involved in clinical and advocacy work with marginalized and underserved urban populations and refugees and asylum-seekers from different countries. I was creating a bridge to my earlier educational and social roots. I ended up doing work in Peru, Liberia, Italy, Haiti, and Senegal and presenting at international conferences in Asia, South America, and Europe. Eventually, I took the plunge to work abroad full-time as a psychologist—first in Bahrain and then in Botswana.

Unwittingly, I had been storing accounts of my international adventures over the years and recently had them published in what I call the ultimate travel guide: Global Insights - The Zen of Travel and BEING in the World. In it, I explore the personal-development value of travel and give tips—for parents, students, young, and old—on how to maximize their travel experience.

My advice to parents: Travel can be one of the best educational enrichment opportunities for your gifted child because it crystalizes so much classroom and life experience. The good news is that, despite financial barriers, it can still be accessible to families from all socioeconomic backgrounds. While my parents were certainly educationally advantaged and able to get me involved in a variety of cultural and travel activities, they were by no means wealthy. Funding is available for travel, especially for high-achieving children. Parents can search private and government sources to help support study abroad and cultural immersion trips so that lack of money does not have to translate into missed opportunities. Help your gifted child see the world, and your child will better understand her or his place in it!

Nicole M. Monteiro, Ph.D. is a clinical psychologist and Assistant Professor of Psychology in the Department of Professional Psychology at Chestnut Hill College. Find out more about her work at www.nicolemonteirophd.com and her book at www.zenwanderlust.com.

view

Telling a deeper story about student success in Cleveland

10.7.2016
Blog

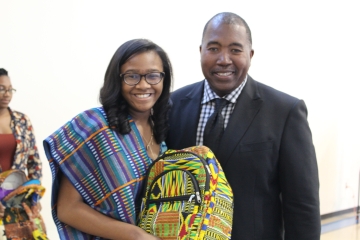
NOTE: All photos used in this piece were graciously provided by the Cleveland Transformation Alliance. The photo at the top of this page features HBCU Preparatory School student Meiyah Hill and school principal Tim Roberts.

Standardized test scores are the most common measure of academic success in our nation’s K-12 schools. While they are an important indicator, most observers would agree that tests don’t tell the whole story about what’s happening in our public schools.

Given the recent changes to Ohio’s assessments and standards and their impact on test scores statewide, the need to tell a deeper story about public education has become even more evident.

In Cleveland, we know that Cleveland’s Plan for Transforming Schools is enabling both district and charter schools to create new learning environments that are laying a foundation for sustainable academic improvement. Progress is slow and not always visible from the outside, but it’s happening.

That’s why the Cleveland Transformation Alliance recently partnered with Civic Commons ideastream to share powerful stories about education in Measuring Success Behind the Numbers. The conversation included three storytellers:

  • Student Meiyah Hill talked about how HBCU Preparatory School, a charter middle school in Cleveland, made her feel part of the school family and challenged her so she was ready to get into one of the Cleveland Metropolitan School District’s highest-performing high schools, the School of Architecture and Design at John Hay;
  • Parent Larry Bailey told the story of how he went from being a drop-the-kids-at-the-door dad to leading his school’s parent organization;
  • Principal Lee Buddy, Jr., into his second year at a district school, spoke of his vision and work to expand partnerships and opportunities for his students.

CTA image 2 Bailey

Cleveland parent Larry Bailey

After the audience heard these stories, we sat down with three educators whose job it is to make sure thousands of Meiyah Hills can experience the transformative power of education, as many Larry Baileys get pulled into their children’s education, and hundreds of leaders like Lee Buddy are empowered to make a difference at the school level.

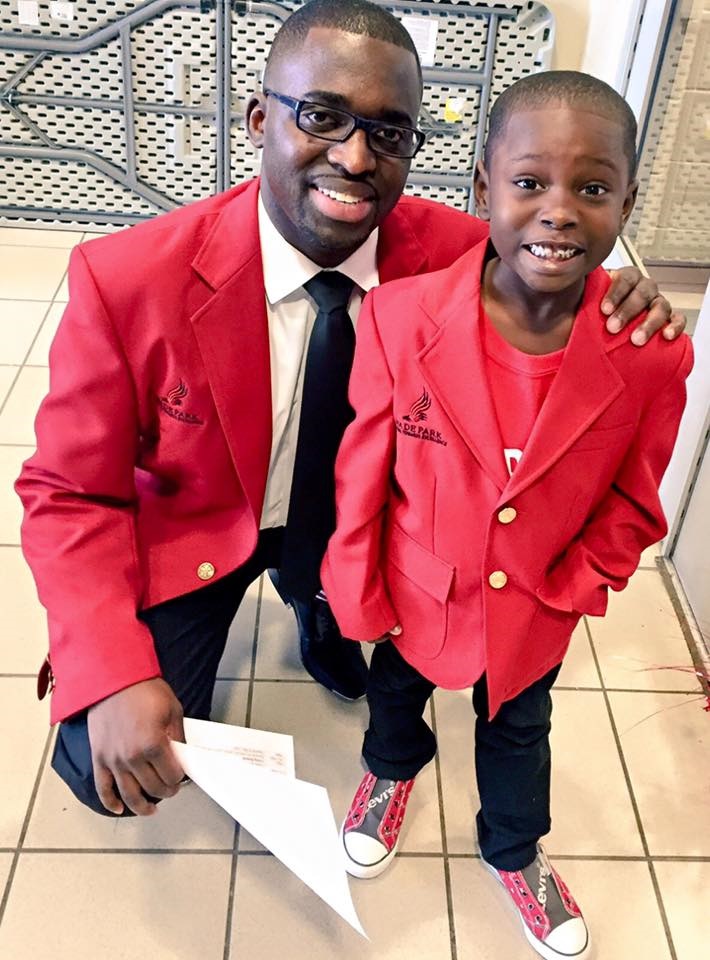
CTA image 1 Buddy

Lee Buddy, Jr., principal of Wade Park School, with one of his students

Connecting the individual stories to the bigger picture of transformation in Cleveland were Diana Ehlert, CMSD central office administrator; JaNice Marshall, who leads efforts at Cuyahoga Community College to engage K-12 students and parents in preparation for college and career; and Mary Ann Vogel, chief educator at the Intergenerational Schools, part of Cleveland’s successful Breakthrough charter school network. The panel’s dialogue focused on school culture, the importance of the broader community in transformation efforts, and how success is measured on an ongoing basis. We wrapped up with a lively Q&A session.

CTA image 3 Hill family
Student Meiya Hill (center), with her family

As the Transformation Alliance found in its second annual report on the implementation and impact of the Cleveland Plan, released in September 2016, progress in Cleveland is too slow, but we expect that changes happening now will lead to clearer academic gains in the future. The stories and dialogue shared in Measuring Success Behind the Numbers provided more evidence of the transformation that’s taking shape in our city.

Piet van Lier is Executive Director of the Cleveland Transformation Alliance.

The Cleveland Transformation Alliance is a public-private partnership created to serve as a voice for accountability and advocacy. The Alliance has four work roles: assess all district and charter schools in Cleveland; communicate with families about school quality and options; ensure fidelity to the Cleveland Plan; monitor charter school quality and growth.

*****

On October 27, 2016, the Alliance will host a dialogue focused on how deeper partnerships are driving educational innovation in Cleveland. See www.innoeducate.eventbrite.com  for more information.

view

2016 Citizen-Readiness Index

Jamie Davies O'Leary
10.7.2016
Blog

This report from the Council for a Strong America provides an alarming snapshot of how ill-prepared many of the nation’s young adults are to be productive members of society.

The Council is an 8,500-member coalition comprised of law enforcement leaders, retired admirals and generals, business executives, pastors, and coaches and athletes. Its inaugural “Citizen-Readiness Index” gives more than three quarters of states a C or below on the index, due to staggering numbers of young people who are 1) unprepared for the workforce, 2) involved in crime, or 3) unqualified for the military.

Ohio received an overall C grade, earning some of the top marks for workforce and crime indicators. More specifically, 12 percent of Ohio’s young people ages 16–24 were reported to be unprepared for the workforce, a relatively low percentage nationally that earned Ohio a B. Ohio also earned a B on crime, with eight arrests per one hundred people (among those ages 17–24)—one of the lowest numbers nationwide. On military readiness, however, Ohio earned a D. A whopping 72 percent of youth ages 17–24 were ineligible for military service. Eligibility to enter the military depends on a range of factors, including physical fitness and attainment of a high school diploma.

Nationwide, almost a third of our young people (31 percent) are disqualified from serving in the military due to obesity alone. Factoring in drug abuse, crime (more than 25 percent of young adults have an arrest record), and “educational shortcomings” raises that number to 70 percent. (Unfortunately, the military readiness numbers aren’t broken out at the state level. We don’t, for example, know what percentage of Ohio youth are disqualified due to obesity versus other factors.)

These data are shocking and should remind everyone of the stakes at hand. Given the proven and widely known negative correlation between educational attainment and crime, drug use, unemployment, and other negative life events, it is all the more imperative that K–12 schools do a better job preparing young people not just for college but for life as upstanding, productive citizens.

Unfortunately, the report doesn’t address K–12 public school quality, nor does it provide many concrete steps for state or local leaders—where education policy is truly set—to address the citizen-readiness crisis. Instead, it offers a set of recommendations geared specifically at Congress and the next president to address the problem.

Part 1, “strong families,” calls for Congress to reauthorize the Maternal, Infant and Early Childhood Home Visiting (MIECHV) program. Outlining research on the relationship between childhood trauma (affecting nearly a quarter of all children) and crime and drug use, the report makes a case—albeit a loose, indirect one—for reauthorizing the program, which serves 150,000 at-risk parents and kids.

Part 2, “quality early education,” dives into research on the long-term gains offered by high-quality preschool, but it misses the boat in its broad recommendation to reauthorize Head Start and expand the Preschool Development Grant Program. While making a strong moral case for investing in children, the Council overlooks research indicating that academic gains from preschool often wear off and that many current early education programs are woefully insufficient. (It does, however, acknowledge the uneven quality of Head Start.) Further, because it ignores questions about the quality of K–12 public schools, there’s no guarantee that suggested improvements to early learning will be sustained over time and ultimately reap the intended benefits (higher education attainment, lower crime, increased readiness for military, etc.).

Part 3, healthier schools, is perhaps the most relevant section, given the coalition behind this report (including military generals, coaches, and athletes), and the one that might be most practically addressed at the state level. Even if the other recommendations were implemented fully and school quality was improved dramatically, obesity would still disqualify a significant number of people from the military. Sixty percent of young adults are obese or overweight (according to standards set forth by the American Medical Association). These numbers are worrisome not only in light of military ineligibility but in terms of the life-long health consequences. The report recommends that Congress and the president “defend science-based nutrition standards” like those embedded in the Healthy, Hunger Free Kids Act of 2010. Specifically, it calls on lawmakers to support the Child Nutrition Reauthorization introduced last year by the Senate Agriculture Committee. And it implores states to place a greater priority on physical education programs, which have waned in recent years. According to the report, the percentage of schools requiring students to take physical education has declined significantly in the last fifteen years, as has the amount of time spent on recess.

Despite not devoting energy or ink to discuss the academic quality of K–12 schools, the Citizen-Readiness Index does an excellent job of outlining the dire ill-preparedness of too many young people for jobs, college, or the military. The scope and commitment of the bipartisan coalition behind this report is impressive, even though its recommendations take on an equally broad, everything-and-the-kitchen-sink approach. As Ohio develops its state accountability plan for the Every Student Succeeds Act (ESSA), it might be worth including “citizen readiness” as a high school indicator.

SOURCE: Council for a Strong America, “2016 Citizen-Readiness Index” (September 2016).

Fordham Logo

© 2026 The Thomas B. Fordham Institute
Privacy Policy
Usage Agreement

National

P.O. Box 110
Burke, VA 22009

202.223.5452

[email protected]

Ohio

P.O. Box 82291
Columbus, OH 43202

614.223.1580

[email protected]

Sponsorship

130 West Second Street, Suite 410
Dayton, Ohio 45402

937.227.3368

[email protected]