

Quality Choices
House Bill 524: An opportunity for Ohio to strengthen its value-added system
Making a vital aspect of school accountability even better
Making a vital aspect of school accountability even better

Ohio’s student growth measure—value added—is under the microscope, which provides a good reason to take another look at its important role in school accountability and to see if there are ways it can be improved. On April 19, state Representatives Robert Cupp and Ryan Smith introduced House Bill 524, legislation that calls for a review of Ohio’s value-added measure. In their sponsor testimony, both lawmakers emphasized that their motivation is to gain a strong understanding of the measure before considering any potential revisions.
The House Education Committee has already heard testimony from the Ohio Department of Education and Battelle for Kids; it is expecting to hear from SAS, the analytics company that generates the value-added results, on May 17. In brief, value added is a statistical method that relies on individual student test records to isolate a school’s impact on growth over time. Since 2007–08, Ohio has included value-added ratings on school report cards, though data were reported in years prior.
As state lawmakers consider the use of value added, they should bear in mind the advantages of the measure while also considering avenues for improvement. Let’s first review the critical features of the value-added measure. (The discussion in this article pertains mainly to school-level value added, not teacher-level—a subject for another day.)
Unlike student proficiency measures, value-added results don’t correlate with demographics. While education reform is focused on narrowing achievement gaps, those gaps remain stubbornly wide. Accountability systems based on proficiency alone unfairly punish disadvantaged schools even when they are helping students make progress over time. This is because academically challenged students are less likely to “pass” the state assessment, especially now that passing scores are more rigorous. But as a measure that zeroes in on growth, value added places schools on a more even playing field for accountability purposes. Consider Figure 1, which displays almost no relationship between value-added scores and economic disadvantage (for charts from previous years, see here and here). Schools with highly disadvantaged populations can and do perform well on this measure. It has the added benefit of highlighting how well schools in middle- and upper-income communities are meeting the needs of their students too.
Figure 1: Value-added index scores versus economic disadvantage – Ohio schools, 2014–15
[[{"fid":"116116","view_mode":"default","fields":{"format":"default"},"type":"media","link_text":null,"attributes":{"height":"679","width":"1157","style":"width: 500px; height: 293px;","class":"media-element file-default"}}]]
Value-added methods have been studied extensively by education researchers. Value-added methods are not a passing fad or methodological mystery. In fact, the pioneering value-added models go back to the early 1970s when Stanford economist Eric Hanushek and others began using testing data and statistical methods to measure a teacher’s contribution to learning. Since that time, economists and education researchers have studied, advanced, and refined the methods; today, most states incorporate a value-added measure (or student growth percentiles) into their school accountability systems. There are, of course, limitations to the use and application of these measures, and few would argue that value added alone is sufficient in an evaluation of either a school or teacher. But value added provides the best possible empirical evidence of a school’s impact on achievement. As Harvard researcher Thomas Kane writes, “Value-added estimates capture important information about the causal effects of teachers and schools.”
Value added focuses on the growth of individual students. Using student-level data—as value added does—is the proper way to measure a school’s contribution to growth over time. Value added takes into account a student’s prior achievement and compares her year-to-year growth to pupils with a similar achievement history. When prior achievement is accounted for and appropriate student-to-student comparisons are made, analysts can control for the influence of demographics while also ensuring that schools are evaluated by a consistent growth expectation—in layman’s terms, one standard year of learning. While helpful in the absence of individual student data, statistical analyses that use school-level data (like the California Similar Students Measure) are not as robust as measures like value added. Ohio policy makers should insist on the highest-quality measurements of school effectiveness and not settle for anything less.
* * *
Because value added plays such an important role in Ohio, lawmakers should also consider strengthening state policy as it relates to value added. The following adjustments would provide a good start:
Figure 2: The distribution of A–F value added ratings by district (left) and by school (right) – 2014–15
[[{"fid":"116117","view_mode":"default","fields":{"format":"default"},"type":"media","link_text":null,"attributes":{"height":"592","width":"1206","style":"width: 600px; height: 295px;","class":"media-element file-default"}}]]In sum, value added must remain a critical component of school accountability, and policy makers shouldn’t backtrack on its use. Without a growth measure, we would rate schools almost solely on proficiency-based measures—a flawed method. Perhaps most important is what growth measures communicate to parents, educators, and the public: Every student matters and all kids can learn, no matter their starting point.

The federal Charter Schools Program (CSP), which provides seed money for charter start-ups primarily through competitive state grants, got an upgrade in the Every Student Succeeds Act (ESSA) in December. Around the same time, CSP got a 32 percent funding boost from Congress. At its highest funding level ever, the program is primed to help states grow their charter sectors—a worthy goal considering that over a million students nationally wait for open seats in charter schools. The new program prioritizes strong authorizing practices and equitable funding for charters, and it attempts to influence state policies toward those ends.
Background
Formed just three years into the nation’s charter movement, CSP embodies Washington’s bipartisan commitment to charters and is responsible for helping launch or expand over 40 percent of today’s operational charter schools. CSP was first created in 1994 as an amendment to the Elementary and Secondary Education Act of 1965 via the Improving America’s Schools Act. At its outset, it was a bare-bones initiative that made competitive grants available to states to host their own sub-grant competitions (for which new start-ups or conversion schools could apply). Requirements were minimal: State applicants merely had to have a charter law, and school applicants had to adhere to the basic definition of a charter school (be nonsectarian, free, enroll via lottery, etc.). Its initial appropriation was just $6 million (FY 1995), compared to $270 million in FY 2017 and 18.
CSP’s first attempt to influence state charter policy appeared when the program was reauthorized through the Charter School Expansion Act of 1998. Priority would go to states in which charter schools were evaluated at least once every five years against the academic goals outlined in their performance contracts. Such states also had to exhibit one or more of the following: 1) demonstrated progress in increasing the number of high-quality charter schools, 2) multiple authorizers and an appeals process if local education agencies were the only authorizer options, and 3) a guarantee that each charter school had a “high degree of autonomy over…[its] budgets and expenditures.” In short, the feds rewarded states that were serious about charter school growth and preserving schools’ autonomy—with an occasional check on performance.
The No Child Left Behind Act (NCLB) of 2001 further expanded the CSP,[1] but its competitive priorities remained the same. While many changes have been made to CSP through congressional appropriations in the years since, the law authorizing the CSP was itself unchanged until just a few months ago.[2]
CSP under the Every Student Succeeds Act (ESSA)
In some instances, ESSA codifies what had become commonplace under past appropriations acts, like making the CMO-level competition permanent. But it also makes several new changes, asking states to focus more on quality than they have in the past—a reflection of President Obama and other political leaders’ support for specifically expanding high-quality charter schools. More than its predecessors, it attempts to target funds to CMOs and schools with stronger track records (as reflected in its preference for proven charter school models over novice applications) and to states with climates conducive for long-term charter success. It does this specifically by placing a premium on authorizing quality and funding equity. The modernized CSP requires that a portion of state grants be spent on technical assistance for authorizers and that state applicants provide details about authorizers’ academic evaluations of schools, financial audits, and accountability decisions. It also looks especially favorably on states with strong authorizing practices. Finally, CSP gives priority to states that provide equitable financing and facilities support for charter schools.
The revamp expands applicant eligibility—reform-minded governors, state charter boards, and charter support organizations can now compete for state grants. And new flexibility is given to schools in how they spend sub-grants. These are all welcome updates that will push states to consider what is necessary to create a high-quality charter sector over the long term and ultimately maximize CSP funds. (For a more detailed look, see Table 1.)
In a few areas, the program’s guidance veers into overreach. Most notably, ESSA suggests that states provide technical assistance to schools to reduce disciplinary practices that “remove students from the classroom.” This is too in-the-weeds for the feds to be dictating. It also potentially undermines another grant requirement—that charter schools in winning states have full autonomy over operations. For the CMO-level competition, priority will be given to those with “racially and economically diverse student bodies,” and the grant competition more broadly allows charter schools to use weighted lotteries to give disadvantaged students an edge in enrollment. These provisions demonstrate a renewed focus by the feds on school integration that is well-intentioned but still unnecessary. Charter schools—and the parents driving demand—are best suited to determine whether integration is a worthy goal in and of itself.
Still, the new CSP builds on two decades of hard-earned experience and incentivizes at least two of the right things (authoring quality and better access for charters to funding and facilities) to improve the odds that charters will be viable over the long haul. Unlike some federal competitive grant programs, it prods states to pass better laws without manhandling them entirely. It’s up to each state to create strong legal frameworks within which CSP funds can be maximized, and the program’s focus on best practices in authorizing and funding will hopefully prompt policy upgrades in both areas. This will benefit charter schools—and ultimately their students—regardless of where CSP money lands.
Table 1: New Charter Schools Program provisions under ESSA
Replicating what works | CMO competition made permanent. In the past, the competition for charter management organizations (CMOs) to expand and replicate their schools was funded through appropriations. Now it’s embedded in ESSA. Focus on track record. Previously, a competitive priority was placed on novice CMO applicants (among other priorities); that was removed in ESSA. |
High-quality authorizing | Dedicated funding to promote high-quality authorizing. Winning states must use a small portion (not less than 7 percent, nor more than 10 percent) of their awards to provide technical assistance to authorizers, specifically to develop capacity to conduct fiscal oversight and audits of their schools. This technical assistance funding for authorizers is unprecedented. High-quality authorizing as part of state’s application. Applying state entities are required to show the extent to which authorizers annually assess the performance data of their schools; review independent financial audits; and hold charter schools accountable for the academic, financial, and operational promises laid out in their charter contracts. Priority for states with strong authorizing practices. The new CSP program considers whether states ensure authorizing best practices (among six priority areas) when determining awards. |
Funding equity | Priority for states with equitable funding. States that provide equitable financing for charter schools (compared to what traditional schools receive) and facilities support (e.g., facilities funding, assistance with facilities acquisition, ability to share in bonds or mill levels, right of first refusal to purchase school buildings) will be given priority over states that do not. Facilities Financing Assistance. The Credit Enhancement program and State Facilities Incentive Grant existed in prior rounds of CSP but are now given a dedicated percentage of funding: 12.5 percent of total CSP funds each year. |
Autonomy and flexibility | School-level autonomy. State applicants are required to assure that charter schools have autonomy over budgetary and operational decisions (including personnel). This was previously a priority area, but not required. Schools’ use of funds. Schools winning CSP funds through their state entities may use the grant money in several ways that were previously not allowed, including: hiring and compensating teachers, leaders, and staff during the school’s planning period; acquiring equipment (including technology); minor facilities repairs and renovations; one-time startup transportation costs (buying a bus); and recruiting students and staff. Pre-K and feeder patterns. ESSA updates the definition of a charter school, making it allowable for CSP-winning charters to serve preschool students and automatically enroll students based on feeder patterns. (Of course, state laws may still stand in the way.) |
Equity | Weighted lotteries. Unless otherwise prohibited by state law, awards may go to states where charter schools use weighted lotteries in order to prioritize the admission of disadvantaged students. Meeting the needs of all students. Among a list of several required assurances, state applicants must support charter schools in meeting the needs of all students, including students with disabilities and English language learners, and verify that any authorizer of a school winning CSP funds monitors its schools in recruiting, enrolling, and meeting the needs of all students. States must also commit to providing technical assistance to school applicants to promote the inclusion of all students, “including by eliminating any barrier to enrollment for educationally disadvantaged students (who include foster youth and unaccompanied homeless youth),” and to support students by improving retention and reducing the “overuse of discipline practices that remove students from the classroom.” |
Other parameters | Frequency of state grants. State grants will be awarded each year (to a minimum of three states) rather than approximately every other year. Expanded eligibility for state grants. Previously, only state education agencies could apply. Under ESSA, state charter boards, governors, and charter support organizations may also apply and administer the grant. Increased federal oversight. ESSA allows the secretary of education to terminate or reduce the amount of a grant if a state entity isn’t living up to its application promises, based on a review prior to the third year of the grant (and prior to each succeeding year—a grant can last up to five years). The funds may be reallocated to other states. |
Sources: NAPCS summary and background document, text from the Every Student Succeeds Act
[1] NCLB expanded CSP in terms of funding ($200 million in FY 2002), eligibility (charter school “developers” could apply directly if their state SEA had not), and programming (by setting up the Charter School Facilities Incentive Grants Program as well as the Credit Enhancement program meant to help charter schools acquire facilities).

In 2014, for the first time, the overall number of Latino, African American, and Asian students in public K–12 classrooms in America surpassed the number of non-Hispanic white students. To better understand what this “majority minority” student body might mean for public education going forward, the folks at the Leadership Conference Education Fund asked Latino and African American parents what they thought about America’s K–12 system, as well as what sort of education they want for their children.
Researchers surveyed a nationally representative sample of eight hundred African American and Latino adults (parents, grandparents, etc.) actively involved in raising a school-aged child, also conducting focus groups in Chicago (Latinos) and Philadelphia (African Americans).
As with other such surveys, a large majority of parents rated their own children’s schools as “excellent” or “good” at preparing students for success in the future. (It is interesting to note, however, that parents whose children attended schools that were mostly white were more likely to rate those schools positively.) Yet parents were also pessimistic about the quality of public schools writ large—especially for students of color. And they felt that funding, technology, and excellent teachers were inequitably distributed in favor of predominantly white and high-income schools.
The survey does not delve deeply into parents’ bias toward their children’s schools, but it does offer an interesting clue: When participants were asked what factors propelled low-income African American or Latino students into college, the overwhelming response was “support from family”; “the students’ own hard work” came in second. “Education received at school” was a distant third. And when researchers asked whether U.S. schools even try to educate African American and Latino children, the vast majority of respondents chose “they are trying their best, even if they often leave many behind.” A new take on the soft bigotry of low expectations?
The authors of the report tout the finding that parents perceive themselves to have “a lot of power” to bring about needed changes, despite also seeing themselves as holding less sway than state and federal government, superintendents, and school boards. So perhaps one way to narrow the achievement gap between African American and Latino students and their white peers is to give this new education majority more power to influence education in their communities by expanding high-quality schools of choice and assisting moms and dad in picking the best schools for their children.
One way or another, policy makers ought to start listening. Higher expectations for students, better technology, welcomed parental involvement, access to tutors, and top-quality teachers are all high on the wish list for these parents. Sounds like they know what they’re talking about.
SOURCE: Anzalone, Liszt, Grove Research, “New Education Majority: Attitudes and Aspirations of Parents and Families of Color,” The Leadership Conference for Education Fund (April 2016).
Last month, Attorney General Mike DeWine toured Citizens Academy, one of the eleven charter schools in the Breakthrough Schools network. Breakthrough, whose schools rank among the top in the state, serves 3,300 Cleveland students in grades K–8. Founded in 1999, Citizens Academy is among Ohio’s oldest charter schools and places special focus on both academic excellence and responsible citizenship. We at Fordham spotlighted Citizens as one of Ohio’s high-performing, high-poverty schools in our 2010 report Needles in a Haystack. The charter school has also been named a National Blue Ribbon School by the U.S. Department of Education and has received honors from the Ohio Department of Education. Today, the school educates approximately 440 pupils, almost all of whom come from low-income families.

Attorney General Mike DeWine poses for a photo with Citizens Academy students
Attorney General DeWine’s visit to Citizens Academy is especially fitting, as he has championed initiatives to rebuild Ohio’s urban neighborhoods by promoting economic development and neighborhood and school safety. High-performing charter schools like Citizens and its Breakthrough counterparts play a vital role in creating safe, sustainable neighborhoods where families want to live, work, and play. In fact, Citizens Academy is located in a previously vacant school building that was in serious disrepair prior to Breakthrough’s purchase of the site. This threatened the safety and wellbeing of the surrounding neighborhood’s residents, especially children. But the once-blighted property is now home to one of the finest charter schools in Ohio.
DeWine has publicly praised Breakthrough’s work, most recently at a Cleveland City Club event last December. Throughout DeWine’s visit, Citizens Academy staff and students showcased the school’s dual focus on academic excellence and citizenship development. John Zitzner, the president of Friends of Breakthrough and one of the network’s original founders, said, “We appreciate Attorney General DeWine’s commitment to protecting Ohio families and kids and his support for high-quality education as a means to both personal success and vibrant, sustainable communities.”
We agree. Kudos to Attorney General DeWine for recognizing this deserving public charter school. Kudos also to Citizens Academy for their contribution to revitalizing Cleveland’s communities—and most of all, for making a big difference in the lives of thousands of young people.
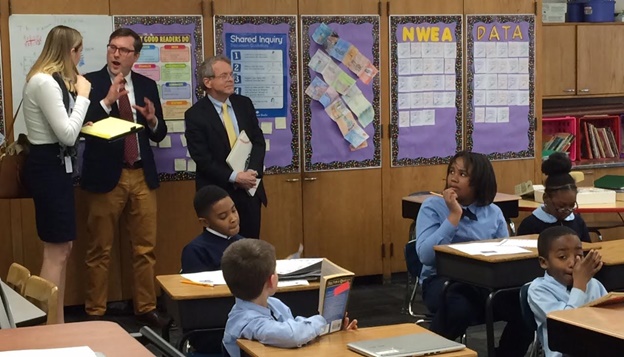
Attorney General Mike DeWine visits Citizens Academy classrooms with Lyman Millard and other Breakthrough staff

President Obama signed the new federal education law, the Every Student Succeeds Act (ESSA), in December 2015. Since then, there’s been a flurry of discussion around rule making and the differences between ESSA and NCLB. One new feature is a provision that permits states to award money to districts for direct student services (DSS), an umbrella term that includes a wide range of individualized academic services intended to improve student achievement.
Starting in 2017–18, ESSA permits states to reserve up to 3 percent of their Title I funds to distribute to districts interested in providing direct student services. A recent report from Chiefs for Change estimates that, based on fiscal year 2017 Title I estimates, the funding available for direct student services ranges from just over $1 million in Wyoming to over $54 million in California. There are, of course, a few stipulations: If states opt to reserve these funds, 99 percent of the total must be distributed directly to districts (presumably through a competitive grant program). Districts are empowered to choose whether or not to apply for a grant and how to spend any awarded dollars, though state-created grant applications could allow states to nudge districts in certain directions. States must also prioritize districts with the highest number of schools that are identified as “comprehensive support” or “targeted support” schools (ESSA’s new labels for schools in need of intervention).
ESSA’s direct student services provision is somewhat similar to NCLB’s supplemental educational services program, though the differences are far greater. For instance, NCLB required all districts with at least one school identified as “needs improvement” for two or more years to reserve between 5 and 20 percent of their Title I allocation to provide supplemental educational services, which consisted mainly of tutoring (though other types of enrichment that met certain qualifications were also acceptable). ESSA, on the other hand, allows states to choose to reserve 3 percent of their Title I funds and then permits states to make grants to districts that apply to participate. ESSA’s list of what constitutes direct student services is also far more diverse. Districts that apply for and win a state-awarded DSS grant are able to offer any of the following services: enrollment and participation in academic courses not otherwise available in school; credit recovery and academic acceleration courses; assistance for students completing post-secondary-level instruction and exams (including AP and IB courses and reimbursement for low-income students taking exams); components of personalized learning; and transportation costs associated with transferring to a school of choice, including charters. Furthermore, while districts can offer these services themselves, they can also outsource them to other providers, including other districts, community colleges or other institutions of higher education, non-public entities, community-based organizations, or tutoring providers that are approved by the state.
As states consider whether to set aside the money, it’s useful to examine more deeply what districts could use the funds for. Here’s a breakdown of two options available through direct student services.
Enrollment and participation in academic courses not otherwise available in school
In their analysis of ESSA, the Foundation for Excellence in Education argues that the direct student services provision is an ideal opportunity for states to create or supplement a statewide course access (a.k.a. “course choice”) policy. States are permitted to use 1 percent of the 3 percent reserved for DSS to cover administrative costs; this funding could be used to “develop infrastructure” for a course access program, including “the review of provider applications, establishment of a course catalog, and monitoring of providers.” This would be a boon to districts that struggle—due to finances, hiring troubles, or location—to offer elective or AP courses. The establishment of a statewide course access program would also benefit districts that opt not to apply for DSS funds. (For more on course access, check out the resources here.)
ESSA language explicitly mentions career and technical education (CTE) courses as an option in this section. A recent Fordham study found that students with greater exposure to CTE are more likely to graduate from high school, enroll in a two-year college, be employed, and earn higher wages. Students taking more CTE classes are also just as likely to pursue a four-year degree as their peers. Given these findings, it makes sense for states without CTE infrastructure to use their 1 percent of administrative funding to create a system. (Fordham’s home state of Ohio is an excellent model). Districts located in a state that already has a robust CTE sector could apply for awards to expand their offerings or partner with local colleges and businesses.
Components of personalized learning
Personalized learning is another umbrella term encompassing a variety of models and programs that tailor learning experiences to each student. A recent study from the RAND Corporation examined a few personalized learning strategies, including competency-based progression, learner profiles, and flexible learning environments. The study found that a majority of the schools saw positive effects in student math and reading performance over two years—and that growth continued into the third year in both subjects. Relative growth rates were higher for students with lower starting achievement, and score growth was substantial relative to national averages. While there are certainly more personalized learning models than those that RAND investigated, these strategies are a great place for districts to start.
Personalized learning is often supported by technology, but that’s not always the case; ESSA language also identifies high-quality academic tutoring as an option. What the term “high-quality” means isn’t expressly spelled out in law, but one can safely assume that programs that are research-based or have a demonstrated history of raising achievement fit the bill. If that is indeed the case, a recent paper explaining a tutoring model developed by Match Education offers a great option for districts to consider. Match’s program pairs students who have fallen behind in math with a tutor who works with them in addition to their regular math classes. Researchers estimate that the program helped students gain between one and two extra years of math above what is normally learned in a single year. In addition, participating students improved their math grades, the chances that they would fail their math courses were cut in half, and the chances of failing a non-math course were reduced by 25 percent.
***
The options for states and districts interested in direct student services are pretty close to endless. Sites like the What Works Clearinghouse and detailed publications from groups like Chiefs for Change offer districts solid ideas for which services to invest in, and critical summaries of recent research are a good way to steer clear of less promising ideas. ESSA language requires states to conduct “meaningful consultation with geographically diverse local education agencies” before being permitted to reserve funds for direct student services; interested states should start seeking stakeholder input during the upcoming school year in order to be ready for implementation in 2017–18. Overall, both districts and states should see ESSA’s direct student services provision as the perfect opportunity to enhance support for struggling students and schools.
In theory, competition has the potential to boost quality and lower prices. But how is this theory working in education? This report from the Friedman Foundation for Educational Choice provides an overview of the research on competition in American K–12 education and offers suggestions to enhance the competitive environment.
The report finds that competition in the form of charters, vouchers, and tax credits does inspire competitive gains, but these gains are relatively small. An in-depth literature review reveals that forty of the forty-two studies on the impact of competition on public school students’ test scores find neutral-to-moderately-positive effects. These findings run counter to one of the most common arguments against choice programs—namely, that school alternatives do academic harm to those “left behind.”
The report also examines whether school choice’s ability to exert market pressure decreases educational costs. While the answer to that question is unclear, the report did note a discrepancy in the efficiency—defined as effectiveness per dollar—between traditional public and choice options. Charter schools appear to be doing more with less; although they receive about 28 percent less funding per student than local district schools, they are achieving greater student gains. According to a study by Patrick Wolf and his colleagues, charter schools were able to generate seventeen more NAEP points for every $1,000 in spending.
To increase healthy competitive pressures, the report advocates for attaching funding to individual students and allowing families to freely choose where their educational dollars are spent (the concept behind “backpack funding”). This arrangement has the potential to improve the education system as a whole as parents “vote with their feet” and their education dollars favor the most sought-after providers. Meanwhile, providers that cannot attract the support of families will naturally go out of business. The authors suggest that the best way to realize this form of funding flexibility is through the use of educational savings accounts (ESAs). These accounts give parents the ability to spend public dollars toward their children’s education as they see fit. They can also be used to save for higher education tuition, making parents more conscious of educational costs.
ESAs don’t have much by way of accountability for results, though they may increase the market pressures for which the authors advocate. Until it can be determined whether the savings accounts really do boost student achievement, ESA proponents will face worries about lax accountability and lower educational outcomes.
Overall, the report reveals that observed gains to district schools are modest given the current state of competition and calls for greater action to ratchet up competition. The recommendations demand greater innovation, creativity, and flexibility for both district and charter schools—all of which should be taken to heart by policy makers.
SOURCE: Patrick Wolf and Anna Egalite, “Pursuing Innovation: How can Educational Choice Transform K-12 Education in the U.S.?,” Friedman Foundation (April 2016).