
Mobile Navigation

  • National
    • Policy
      • High Expectations
      • Quality Choices
      • Personalized Pathways
    • Research
    • Commentary
      • Gadfly Newsletter
      • Flypaper Blog
    • Events
    • Scholars Program
  • Ohio
    • Policy
      • Priorities
      • Media & Testimony
    • Research
    • Commentary
      • Ohio Education Gadfly Biweekly
      • Ohio Gadfly Daily
  • Charter Authorizing
    • Application
    • Sponsored Schools
    • Resources
  • About
    • Mission
    • Board
    • Staff
    • Career
Home
Home
Advancing Educational Excellence

Main Navigation

  • National
  • Ohio
  • Charter Authorizing
  • About

Ohio Menu

  • Topics
    • Accountability & Testing
    • Advanced Education
    • Career & Technical Education
    • Charter Schools
    • Curriculum & Instruction
    • ESSA
    • Evidence-Based Learning
    • Governance
    • Personalized Learning
    • Private School Choice
    • School Finance
    • Standards
    • Teachers & School Leaders
  • Research
  • Policy
  • Commentary
    • Ohio Gadfly Newsletter
    • Ohio Gadfly Blog
    • Events

Research Bites - 1/14/15

Aaron Churchill
1.14.2015

Ohio’s Quality Counts Rating – Poverty Gap Change

In Monday’s post, we examined the achievement gains Ohio has made on the NAEP exams from 2003 to 2013. Needless to say, Ohio’s gains were not all that impressive. In this post, I look at how Ohio fares along the “poverty-gap closing” measure used in EdWeek’s Quality Counts report. (This metric is the difference in NAEP achievement between low- and high-income students—and how that gap has changed over time.) The achievement gap between poor and well-off children is substantial across the entire nation, Ohio included, and thus minimizing the differences in achievement levels is a worthwhile policy objective (preferably, by lifting the achievement of poor students, not through reductions in wealthy-students’ performance). The chart below displays the “poverty gap” trend in Ohio, along with several other states: four other Midwestern states, the four most-populous states, and the national average. Among these states, Ohio had the largest increase in the achievement gap; its gap grew 3.3 points from 2003 to 2013. The state also ranked near the bottom nationally on this indicator—38th in the nation, taken as an average of its math and reading ranks. Meanwhile, New York was the U.S. leader in achievement-gap closing during this time period, shearing off 5.2 points in its gap between low- and high-income students. Ohio has a growing achievement gap between its poor and wealthy students, and in fact, one of the worst achievement-gap trends in the nation.
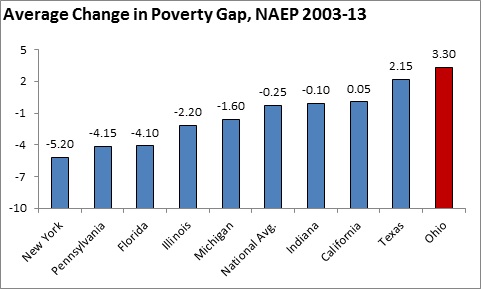
Research Bites Chart

Source: Education Week, Quality Counts. Note: This chart displays each state’s decrease in achievement gaps between poor and wealthy students (negative values) or its increase (positive values) on national tests. I average the gap reduction (or growth) across 4th grade reading and 8th grade math NAEP scores (the test results used by EdWeek).

Topics:
Accountability & Testing
Tags: Midwestern United States National Assessment of Educational Progress New York Ohio
Aaron Churchill 2025 headshot

Aaron Churchill is the Ohio research director for the Thomas B. Fordham Institute, where he has worked since 2012. In this role, Aaron oversees research  and commentary aimed at strengthening education policy in Ohio. He writes regularly on Fordham’s blog, the Ohio Gadfly Daily on topics such as…

View Full Bio
Fordham Logo

© 2026 The Thomas B. Fordham Institute
Privacy Policy
Usage Agreement

National

P.O. Box 110
Burke, VA 22009

202.223.5452

[email protected]

Ohio

P.O. Box 82291
Columbus, OH 43202

614.223.1580

[email protected]

Sponsorship

130 West Second Street, Suite 410
Dayton, Ohio 45402

937.227.3368

[email protected]