Today, the Ohio Department of Education released annual report cards for Ohio’s 610 school districts and roughly 3,500 public schools. Based on data from the 2018-19 school year, report cards include a user-friendly, overall rating along with component ratings that provide additional context. Ratings are anchored in state exam results and other indicators of academic success.
“Parents and communities deserve an honest look at academic performance,” said Aaron Churchill, Ohio Research Director at the Thomas B. Fordham Institute. “Ohio’s report cards remain the backbone of a transparent education system that puts student outcomes at the center. Importantly, report cards include not only point-in-time snapshots of proficiency but also measures of student progress over time. Because progress indicators don’t correlate with demographics, they allow high-performing, high-poverty schools to shine.”
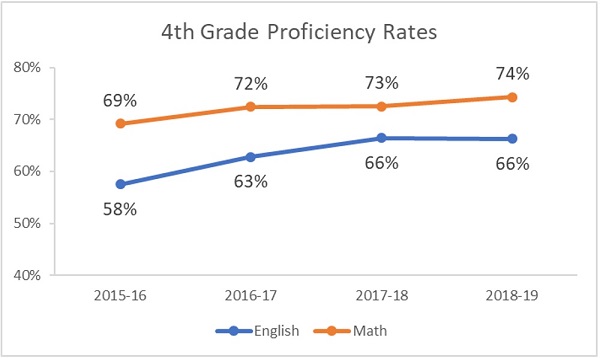
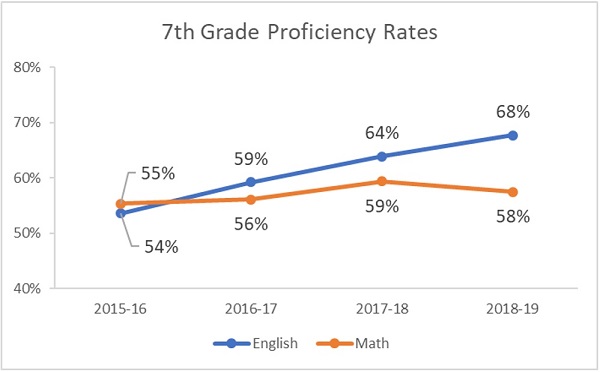
Statewide data reveal gradual improvements in proficiency on state math and English exams. The charts below display proficiency on fourth and seventh grades over the past four years—all years in which students took Ohio’s “next generation” assessments that were first administered in 2015-16.
“Over the past decade, Ohio has raised expectations for schools and students,” continued Churchill. “These reforms challenge all young people to exit high-school ready for college and career, and they are starting to bear fruit. The visible gains in achievement should bolster confidence that Ohio is on the right track.”


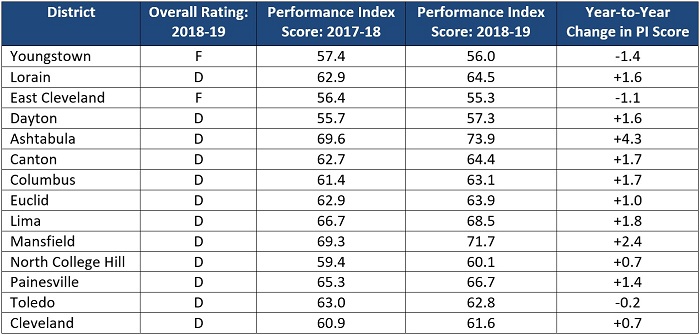
Improvements are also evident in the majority of Ohio’s low performing school districts. The table below displays districts that received an “F” overall rating last year (2017-18) and key results from their 2018-19 report card: Their overall ratings and performance-index scores, a composite measure of proficiency across all tested grades and subjects.


