The Ohio Department of Education (ODE) today released school report cards for the 2016-17 school year. The report cards offer an independent, objective lens through which Ohioans can view student and school performance in their local communities.
“Annual assessment of what students know and can do remains key to a healthy school system,” said Aaron Churchill, Ohio Research Director for the Thomas B. Fordham Institute. “This year’s data are promising and indicate that an increasing number of students are rising to the challenge and meeting Ohio’s higher achievement standards.”
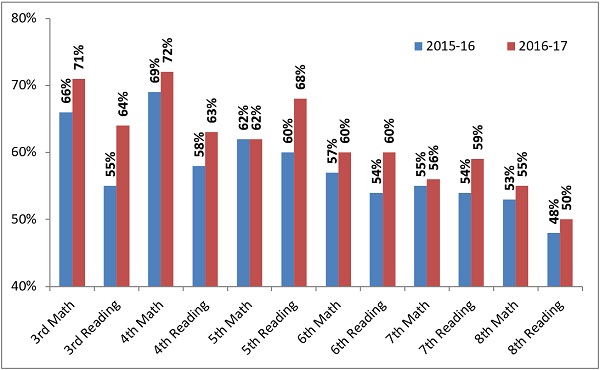
The chart below displays the 2015-16 and 2016-17 statewide proficiency rates in core subjects; these data are from the first two years of AIR/ODE developed assessments, aligned to Ohio’s more rigorous learning standards.

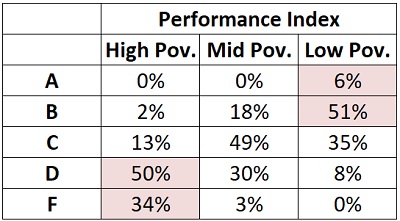
Higher-poverty schools tend to fare worse on Ohio’s proficiency-based measures. The table below shows the distribution of A-F ratings of schools based on the state’s Performance Index—a weighted measure of proficiency—by their poverty rates. Higher poverty schools’ lower ratings on this metric and others—e.g., Indicators Met, Gap Closing, Graduation, and Prepared for Success—reflect in part the well-documented challenges low-income students face in achieving at levels comparable to their peers.

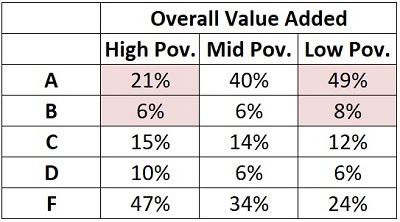
Note: High poverty schools enroll 66 to 100% economically disadvantaged (ED) students; mid poverty is 33 to 66% ED; low poverty is 0 to 33% ED. These poverty levels are the same for the value added data below.
Ohio also assigns ratings on Value Added measures, a more poverty-neutral indicator of schools’ impact on student growth over time, accounting for incoming achievement levels. As the table below displays, both low- and high-poverty schools receive strong ratings on this measure.

Note: These ratings are based on two-year averages of schools’ value-added scores; this table uses the “overall value added” rating (not the Progress component rating).
“We must acknowledge the significant ground that low-income students often need to make up,” said Churchill. “But Ohio’s increasing number of report card metrics—typically correlated with prior achievement—can obscure the gains students are making. Ohio’s value added measure can help as parents and communities look for quality schools, both district and charter, that have positive impacts on student learning.”


