
The characteristics and number of students who take an exam—especially a voluntary one such as the AP exams—are surely important. This week’s blog How do Ohio’s AP scores stack up? showed that Indiana’s AP scores were noticeably below their Midwestern peers, including the Buckeye State. Ohio’s AP scores were, on average, quite competitive with its peer states and well above Indiana’s.
One plausible theory for Indiana’s dismal AP scores is that a greater proportion of its high school students take the AP exams. This may indicate that more lower-achieving students—students who are less likely to score well on AP exams—may be taking AP exams in Indiana compared to other Midwestern states.
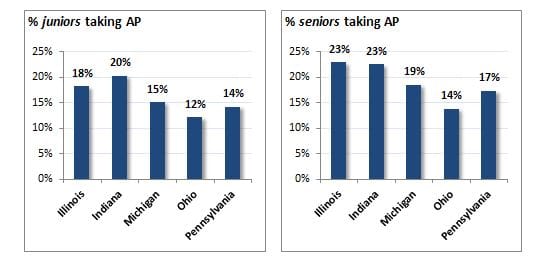
To probe whether this theory holds water, I calculate the percentage of junior and seniors who take the AP exams for Illinois, Indiana, Michigan, Ohio, and Pennsylvania. The charts below show the percentage of juniors and seniors who took at least one AP exam in spring 2012. The table at the end of the post reports the number of public and nonpublic school students in each class as well as the number of test-takers.
Indiana and Illinois lead, Ohio lags – Percentage of juniors and seniors taking at least one AP exam, public and nonpublic students, selected states, 2011-12
Sources: Illinois State Board of Education; Indiana Department of Education; Michigan Department of Education, public and nonpublic enrollment; Ohio Department of Education; Pennsylvania Department of Education; College Board Summary Reports.
The chart shows that Indiana has a similar percentage of its juniors and seniors taking an AP exam compared to Illinois, and a modestly higher percentage compared to Michigan and Pennsylvania. Compared to Ohio, though, Indiana has a substantially higher percentage of AP test-takers—between 8 (juniors) and 9 (seniors) percentage points. So, the data suggest that Ohio may have an advantage over states like Indiana and Illinois in a cross-state comparison of AP scores. For, it is plausible that the AP test takers from Ohio may be the true cream-of-the crop students. However, Indiana’s low AP scores relative to Illinois cannot be explained away by a greater proportion of its students taking the exams.
In the end, it’s unclear what’s driving low AP scores in Indiana. True, it looks like Indiana’s low AP scores can be partially attributed to a higher proportion of its juniors and seniors taking the exams—especially, compared to Ohio. But of course, there could be other explanations: Perhaps it was a bad year for Indiana, or maybe Indiana’s test-takers come from poorer and more disadvantaged communities, or perhaps Indiana schools’ AP programs are simply less effective. Or, might it be a little of all of the above?
Table: Number of 11th and 12th graders and AP test-takers, public and nonpublic schools, 2011-12, selected states

