
Mobile Navigation

  • National
    • Policy
      • High Expectations
      • Quality Choices
      • Personalized Pathways
    • Research
    • Commentary
      • Gadfly Newsletter
      • Flypaper Blog
    • Events
    • Scholars Program
  • Ohio
    • Policy
      • Priorities
      • Media & Testimony
    • Research
    • Commentary
      • Ohio Education Gadfly Biweekly
      • Ohio Gadfly Daily
  • Charter Authorizing
    • Application
    • Sponsored Schools
    • Resources
  • About
    • Mission
    • Board
    • Staff
    • Career
Home
Home
Advancing Educational Excellence

Main Navigation

  • National
  • Ohio
  • Charter Authorizing
  • About

Ohio Menu

  • Topics
    • Accountability & Testing
    • Advanced Education
    • Career & Technical Education
    • Charter Schools
    • Curriculum & Instruction
    • ESSA
    • Evidence-Based Learning
    • Governance
    • Personalized Learning
    • Private School Choice
    • School Finance
    • Standards
    • Teachers & School Leaders
  • Research
  • Policy
  • Commentary
    • Ohio Gadfly Newsletter
    • Ohio Gadfly Blog
    • Events

The Education Gadfly Weekly

Sign Up to Receive Fordham Updates

We'll send you quality research, commentary, analysis, and news on the education issues you care about.
Thank you for signing up!
Please check your email to confirm the subscription.

Ohio Gadfly Biweekly--Volume 12, Number 12

Volume 12, Number 12
5.31.2018
5.31.2018

Ohio Gadfly Biweekly--Volume 12, Number 12

Volume 12, Number 12
view

Don’t punt overall school ratings, again

If kicking the accountability can down the road were an Olympic sport, Ohio policymakers would win the gold medal. The latest example comes from the State Board of Education, which recently recommended that the state legislature again push back the overall A–F rating to fall 2019.

Aaron Churchill 5.31.2018
OhioBlog

Don’t punt overall school ratings, again

Aaron Churchill
5.31.2018
Blog

How Ohio should distribute its school improvement funds

Jessica Poiner
6.4.2018
Blog

Getting to square one: Longstanding troubles hinder the Youngstown turnaround effort

Jeff Murray
5.30.2018
Blog

Testimony given before the House Education and Career Readiness Committee on House Bill 591—5/22/18

Chad L. Aldis
5.22.2018
Blog

Testimony given before the House Education and Career Readiness Committee on Senate Bill 216—5/22/18

Chad L. Aldis
5.22.2018
Blog

How Ohio can pave the way for a stronger, broader charter movement

Aaron Churchill
5.22.2018
Blog

2018 Teacher Prep Review: An examination of graduate and alternative teacher preparation programs

Jessica Poiner
6.4.2018
Blog

Analyzing teacher tenure reform in Florida

Aaron Churchill
5.30.2018
Flypaper
view

How Ohio should distribute its school improvement funds

Jessica Poiner 6.4.2018
Blog
view

Getting to square one: Longstanding troubles hinder the Youngstown turnaround effort

Jeff Murray 5.30.2018
Blog
view

Testimony given before the House Education and Career Readiness Committee on House Bill 591—5/22/18

Chad L. Aldis 5.22.2018
Blog
view

Testimony given before the House Education and Career Readiness Committee on Senate Bill 216—5/22/18

Chad L. Aldis 5.22.2018
Blog
view

How Ohio can pave the way for a stronger, broader charter movement

Aaron Churchill 5.22.2018
Blog
view

2018 Teacher Prep Review: An examination of graduate and alternative teacher preparation programs

Jessica Poiner 6.4.2018
Blog
view

Analyzing teacher tenure reform in Florida

Aaron Churchill 5.30.2018
Flypaper
view

Don’t punt overall school ratings, again

Aaron Churchill
5.31.2018
Blog

If kicking the accountability can down the road were an Olympic sport, Ohio policymakers would win the gold medal. The latest example comes from the State Board of Education, which recently recommended that the state legislature again push back the overall A–F rating to fall 2019. The rating is slated to appear on school report cards for the first time this September and will be based on 2017–18 data. According to Patrick O’Donnell of the Cleveland Plain-Dealer, legislators are mulling the Board’s proposal.

The key word in the previous paragraph is “again,” as Ohio has already delayed overall grades before. Rewind to December 2012 when the legislature passed House Bill 555 and shifted the state from its former school-report-card framework to the A–F format used today. That legislation eliminated the old overall ratings—designations such as “Effective” and “Continuous Improvement”—and called for summative A–F grades starting in 2014–15.[1] Yet as the time drew near for the release of overall grades, lawmakers backed off and delayed them until the 2015–16 school year. Then, in true Britney Spears fashion, they did it again one year later, pushing back the overall rating to its current release date of 2017–18. 

Why did legislators postpone overall grades? Citing the overhaul of the state’s academic standards and assessments, district and teachers’ union leaders urged the legislature to shield schools from consequences for poor performance, including withholding the prominent overall rating. Their argument resonated with lawmakers, and schools were given a reprieve.

But Ohio is now a half-decade into standards implementation, and this spring’s state exams are the third straight year for the assessment designed by the Ohio Department of Education and the American Institutes for Research (AIR). With the standards and assessment policy areas settled, arguments about “time to adjust” are no longer relevant. So proponents of the delay are now saying that the state’s school grading system needs work and, consequently, that the overall grade should be shelved once again.

As we’ve said about a jillion times, state lawmakers do need to retool report cards to make them less complicated and to produce fairer evaluations of high-poverty schools’ performance. To latter end, Ohio legislators should place a heavier weight on student-growth metrics so that schools enrolling primarily disadvantaged pupils aren’t blanketed with overall D’s and F’s, leaving families living in poorer communities unable to differentiate between high- and low-quality schools. By heeding our recommendations right away, state legislators would correct this problem before they issue overall grades starting this autumn.

But even if these important revisions remain undone, legislators should not withhold overall ratings yet again. Consider two reasons why.

First, an overall school rating will help Ohioans make sense of the disparate components of the report card. As anyone who has looked at the present report card knows, it contains an almost endless smorgasbord of performance metrics and letter grades. Without guidance as to which letter grades are central to understanding overall school quality, users are left to puzzle over which grades matter the most. It also leads to “cherry picking” of which grades to focus on, particularly when it comes to media coverage. On the heels of last September’s report-card release, news reports chose to emphasize different measures. In TV media, for example, Fox in Cleveland made the achievement-component grades the center of attention, NBC in Columbus focused on five out of the fourteen letter grades issued last year, and ABC in Columbus seemed to randomly pick the lowest rating on districts’ report card and didn’t even bother to disclose the graded component displayed.

Assigning overall grades will cut through the confusion of Ohio’s dozen-plus report card measures. They’ll create a common yardstick that everyone understands as a concise summary of district or school quality—just as final course grades sum up students’ performance on homework, projects, exams, and more. 

Second, punting overall ratings to 2019 will send yet another troubling message that Ohio isn’t serious about accountability for results. True, this isn’t fashionable these days—and may never be popular, especially among those working in education. It insists on consequences for woeful performance, whether they’re formal sanctions like Academic Distress Commissions, or less formal ones, such as prominent overall ratings that warn parents and communities should there be academic troubles. For schools doing well by students, the summative rating should be of little concern, and perhaps even a point of pride. But when schools demonstrate no evidence of student learning, shouldn’t parents and communities be made aware? Without a clear signal, Ohioans won’t be able to take whatever action is needed to ensure that children receive an excellent education.

The latest NAEP results for Ohio reveal that just two in five students are meeting rigorous academic benchmarks in fourth and eighth grade. College remediation data show that one in three high school graduates need to take “developmental” math or English when arriving on campus. State test results continue to expose glaring achievement gaps between disadvantaged children and their peers. And employers across the state have repeatedly raised concerns about the readiness of young people for the world of work.

Ohio policymakers need to press onward in crafting a well-functioning public school system that helps all students reach their goals and aspirations. On the accountability side, their work is far from finished. But by assigning overall grades this fall, Ohio will take an important step forward in fulfilling its obligation to hold public schools accountable for results—and ensuring that Buckeye families and communities know exactly where their schools stand.


[1] The last “descriptive” overall rating was issued in 2011–12. And per HB 555, overall ratings were not assigned in 2012–13 and 2013–14. 

view

How Ohio should distribute its school improvement funds

Jessica Poiner
6.4.2018
Blog

When state report cards are released this fall, it will be the first time that overall letter grades are assigned to districts and schools. It will also be the first time that these overall grades are used to identify the state’s lowest performing 5 percent of schools, a requirement of ESSA.

It’s been a while since Ohio’s ESSA plan was in the news, so here’s a quick refresher on how the Buckeye State promised to implement the law’s provisions related to struggling schools. ESSA requires states to identify two separate groups of low performing schools: comprehensive support schools (which include the lowest-performing schools in the state) and targeted support schools (which include schools struggling with certain subgroups). Ohio chose to rename each of these categories—comprehensive support schools are known as “priority schools,” and targeted support schools are known as “focus schools.” Priority schools will be identified every three years starting this September. According to the state’s ESSA plan, there are three ways a school can be identified as priority:

  1. It is part of the lowest-performing 5 percent of Title I schools, based on the report card’s overall grade methodology.
  2. It is a high school with a four-year graduation rate of less than 67 percent.
  3. It has one or more subgroups performing at a level similar to the lowest 5 percent of schools and has not improved after a state-determined number of years.

Once identified, priority schools must create improvement plans. They have four years to improve under these plans or face “more rigorous interventions” from the state.

While there’s plenty of research for school officials and district administrators to consider during their planning process, the most promising solutions often require substantial funding. Obviously funding isn’t a silver bullet; when it comes to school improvement, how funds are spent matters at least as much as how much money is spent. But data show that competitive funds can improve student achievement, and significant and multiyear resources are a key tenet of sustainable school turnaround.

That’s where school improvement funds come in. ESSA requires states to set aside 7 percent of their Title I funds to give to schools that have been placed in one of the two identification categories. State education agencies will award these funds to local districts using either a formula or competitive grant process. Based on the federal spending bill that was signed this spring, Title I funding is worth $15.8 billion—which means states will be distributing hundreds of millions of dollars in grants to identified schools over the next few years. Chiefs for Change estimates that the 7 percent set-aside could add up to nearly $41 million for Ohio.

In general, states can choose to dole out these funds however they want. The Texas Education agency used its ESSA plan to incentivize certain types of reform, like grouping identified schools together and providing them with operational flexibility. Based on Texas’s plan, my colleague Mike Petrilli has proposed using the funds to open new charter schools instead of trying to turn around low-performing ones. Ohio’s ESSA plan doesn’t explain how the state intends to distribute the 7 percent set-aside. It’s unclear if that’s because they weren’t required to reveal their plan, or if state officials just haven’t decided how to do it yet. Either way, Ohio’s recent history with the Straight A Fund offers an intriguing path forward.

Straight A was a competitive grant program proposed by Governor Kasich as part of his 2013 biennial budget. It was designed to “support ideas from local educators that promote academic achievement and economic efficiencies” and was funded at $100 million in 2014 and $150 million in 2015. Funding was dropped down to $15 million in both 2016 and 2017 before being cut entirely last summer. Despite its short life, the program showcased some promising ideas and results—all of which were developed by local leaders and teachers.

ESSA’s 7 percent set-aside is a chance for Ohio to capitalize on the strengths of Straight A, while also improving upon its weaknesses. Policymakers could do this by establishing a competitive grant program that uses federal school improvement funds rather than state tax dollars. The competition would be open to priority schools and Academic Distress Commissions, and would follow in Straight A’s footsteps by funding eligible schools with innovative, workable ideas. Rather than focusing heavily on cost savings—which many believe was the downfall of Straight A—the new program would reward promising ideas focused solely on improving student achievement and progress.

Empowering local leaders and practitioners in the form of a competitive grant program would ensure buy-in. One of the most complicated aspects of school improvement is stakeholder engagement, and many promising reform efforts have failed because leaders didn’t gather enough investment from key players like parents and teachers. Championing ideas from those on the ground is a great way to sidestep political pushback. More importantly, though, it’s an inventive way to pinpoint new and groundbreaking ideas. Colorado discovered this firsthand last year with the Succeeds Prize, an award that not only honors the transformational impact of schools and teachers, but also leverages their ideas into professional development designed to scale innovative solutions statewide.

Despite all this potential, though, Straight A had some problems, and state officials should learn from these missteps as they craft a school improvement grant program. (They could also learn from the SIG program, which similarly provided competitive grants to low-performing schools; research indicates that schools committed to the most intensive interventions fared best.) For starters, the application should be rigorous, simple, and straightforward. Administrators in low-performing schools have enough to manage without adding a hefty and needlessly complicated application to the mix. Second, ODE must include site visits as part of their application review process. As John Mullaney and Aaron Churchill have previously noted, this would offer a clearer context of how the proposal would be implemented, and would provide reviewers with an opportunity to ask clarifying questions. Third, the state must set aside funds to evaluate the success of programs. This would inform the public and policymakers about the impact of the funding and identify solutions that could be implemented in other low-performing schools.

Instead of spreading ESSA’s 7 percent set-aside across all eligible schools, Ohio should give these dollars to schools with the best ideas—and the strongest commitments—to dramatically boost student learning. A competitive grant offers the state an intriguing opportunity to capitalize on previous grant programs, elevate the ideas of local practitioners, and support much-needed changes to Ohio’s lowest-performing schools. The release of state report cards and the identification of priority schools are still a few months away. This summer would be the perfect chance for ODE to iron out the details of a school improvement grant competition modeled after the Straight A Fund.

view

Getting to square one: Longstanding troubles hinder the Youngstown turnaround effort

Jeff Murray
5.30.2018
Blog

In a recent analysis of the Academic Distress Commission (ADC) system currently in place in Youngstown City Schools, my colleague Jessica Poiner shows significant deviations from the six habits of highly effective school district turnarounds. These deviations have undoubtedly contributed to a slow start for much needed reform efforts. But the plan is not solely to blame. Youngstown’s history is riddled with apathy and neglect. Even the most miraculous of turnaround plans would have had to contend with a depleted system resistant to change. Here are a few examples of how this neglect has immeasurably complicated the early work of the current ADC and its CEO.

Transportation

Mere days after taking the reins in 2016, Youngstown CEO Krish Mohip received an in-depth report on the district’s transportation system from the Ohio Department of Education (ODE). That report detailed numerous flaws and failings related to bus driver background checks and training, maintenance schedules, efficient routing, and expenditures. With just weeks to go before the start of the school year, every driver had to be rechecked and retrained and every route had to be replanned just to reach baseline operational capacity.

Neither the six habits nor the recent ODE report on the ADC’s progress take into account that getting kids to school in the first place is a longstanding problem for Youngstown City Schools. Even if Mohip could have waved a magic wand and installed the best curriculum and the best teaching district-wide on day one, this structural failing would have curtailed the benefit to students. The immediate problems were solved, but this all-hands-on-deck emergency superseded any other work that CEO Mohip could have been doing in his earliest days. Instead of concentrating on elements of academic turnaround, hiring a top-flight transportation coordinator moved to the top of Mohip’s to-do list. It was time and money well spent, eventually, but it was basic foundation building, not a ramp-up to turnaround.

Special education

Shortly after the transportation debacle, Mohip received another ODE report that documented long-standing inequities and flaws in identifying and providing services to students with special needs. A legacy of low expectations and poor support for some of Youngstown’s neediest students put an immediate barrier between the new CEO and district families. Even with all of the resources provided by the ADC framework, he cannot hope to improve academic achievement before solving this complex structural problem. Despite several important changes under Mohip’s leadership, ODE's most recent review shows continuing problems in this area.

Access to quality

As with all distressed districts, there have been pockets of quality in Youngstown throughout the last ten years—bright spots that any turnaround leader would love to grow and leverage toward more success. Yet these academic oases were isolated and historically inaccessible to most students. Advanced Placement (AP) courses, for example, were traditionally offered at only one high school, while a different high school offered performing arts. Math teaching vacancies were concentrated in certain schools, leaving multiple classrooms with a rotating cast of long-term substitutes, usually in the lowest-performing buildings. Youngstown Early College High School (YEC)—offering accelerated classes and direct access to college courses at neighboring Youngstown State University—has been the crown jewel of the district for nearly a decade. But it is small and full and has a long waiting list, emblematic of the difficulty parents have accessing what quality options exist in Youngstown. It is not surprising that many families simply opted to leave the district.

For those who toughed it out, access issues were exacerbated by the aforementioned transportation woes and a rigid, suspension-based discipline system that could effectively ban students from returning to school buildings for the rest of their academic careers following certain infractions. If the only school open to them is one with poor math instruction, it’s unlikely students will learn enough math to be proficient. Mohip was required to redistribute resources on an ad hoc basis—textbooks, teachers, computers, counselors—and to redesign the discipline code just to build a secure basis for substantive change. These larger efforts—such as expanding YEC and returning to neighborhood schools with AP courses and arts in each building—are the true province of bold turnaround efforts. Is it any wonder that turnaround progress is slow when longstanding neglect of schools and students must be halted first?

Politics

Finally, and perhaps most importantly, the political situation in Youngstown slung a hefty albatross around the ADC’s neck before it even officially existed. Critics of House Bill 70 questioned its constitutionality before the governor’s signature had dried, began legal action a month later, and continue to subject the ADC to protest actions today. Despite the fact that stronger ADC legislation could have been avoided if the district had just improved its academics (and indeed, several other Ohio districts have managed stay just this side of the line over the years), the elected school board and their ever-changing cast of superintendents continued to fiddle while Rome burned—protecting the status quo of “the system” that provided them with power instead.

It’s true that ADC leaders were given a “big yes” that could have helped them and Mohip implement changes more quickly and decisively. But HB 70 complicated this authority by keeping the elected board and district superintendent in place, thereby ensuring ongoing institutional antagonism. The elected board of an ADC district can’t be replaced until the district has failed to make substantial progress for four years. Compare that to New Jersey’s state takeover protocol, which immediately replaces elected boards with advisory boards appointed by the city’s mayor. These advisory members must work with the state-selected leader to execute the turnaround plan; there is no question about who is responsible for the success or failure of the plan, and the board is incentivized to improve quickly with the promise of partial authority being returned to them if they do. Ohio ADCs, on the other hand, operate with a perverse incentive toward failure—or at least toward very slow progress.

*****

Youngstown’s current Academic Distress Commission was born under fire and its CEO began his turnaround efforts following years of systemic neglect in the district. Despite the difficulties, district data and ODE’s most recent report on Youngstown’s progress show some measured improvement. Student population loss has been reversed, new allies are emerging, and the state—for now—remains firmly in support of the effort. All students in Youngstown deserve a quality education, and the turnaround process is far from complete. CEO Mohip and the ADC could still make that a reality if they keep the focus on increasing student achievement as purpose and goal.

view

Testimony given before the House Education and Career Readiness Committee on House Bill 591—5/22/18

Chad L. Aldis
5.22.2018
Blog

NOTE: The Education and Career Readiness Committee of the Ohio House of Representatives today heard testimony on HB 591, a proposal that would make changes to Ohio’s school report cards. Fordham’s Chad Aldis was a witness at this hearing and these are his written remarks.

Thank you, Chair Brenner, Vice Chair Slaby, Ranking Member Fedor, and House Education Committee members for the opportunity to provide testimony today in opposition to House Bill 591.

My name is Chad Aldis, and I am the Vice President for Ohio Policy and Advocacy at the Thomas B. Fordham Institute. The Fordham Institute is an education-focused nonprofit that conducts research, analysis, and policy advocacy with offices in Columbus, Dayton, and Washington, D.C.

Strong, transparent school performance information is a key element to creating a high-performing educational system. It can be used to ensure excellent schools are properly recognized and rewarded for their success. It’s also critical in order for local communities and (when necessary) the state to identify chronically low-performing schools where children are grade levels behind and making no discernable progress. This allows the provision of targeted resources to schools in the greatest need of improvement. For this reason, many civil rights and business groups fought to maintain reporting requirements in ESSA—the new federal education law.  

It’s a little odd to be standing here in front of you as an opponent of HB 591. We agree with a number of the points that Rep. Duffey has made. In a report released last December,[1] (I have copies here for you) we outlined several changes that would maintain transparent information and a strong accountability system but also result in fairer, more streamlined state report cards. The key changes we recommend include reducing the number of A–F school ratings from fifteen to just six, while also striking a better balance between the state’s achievement and growth measures. Updates such as these would produce more user-friendly report cards and treat schools of all poverty levels more evenhandedly. A school successfully helping catch up low-income students who enter school behind should never be deemed a failure.

Unfortunately, House Bill 591, rather than improving the current system, (you know what I’m going to say) throws the baby out with the bathwater. It replaces the present system with data dashboards displaying an array of statistical information but offering no ratings that can help provide a clearer understanding of the data. These dashboards include some fine-grained data that aren’t currently available and would be an improvement; however, these data should be available as supplemental information and not as a primary way of communicating school quality to the general public.

Why shouldn’t we just report the data? To answer that, refer back to Representative Duffey’s PowerPoint presentation. He made a passionate case that a dashboard like that on a car is what we should be aiming for. Everyone knows looking at a speedometer, tachometer, and fuel gauge what’s good and what’s bad. He’s right about that, and that’s precisely why school performance data are different. Parents and communities lack familiarity and context for education data.

How is a car’s dashboard different? Before driving, most Ohioans have driver’s education where they receive formal instruction on driving (including car gauges). They drive their car virtually every day and have driven thousands or even tens of thousands of hours in their lifetime. That makes them very familiar with the dashboard. As an aside, manufacturers have still chosen to provide context to drivers. Take a look at your tachometer; when the RPMs get to a level where engine damage could occur, there are typically red numbers or lines. When your fuel approaches E, even though you know your gas is almost gone, a warning light illuminates.

Conversely, parents and communities—at most—look at their state report cards once or twice a year. To assist the public, Ohio translates dense educational data into school ratings. They provide context.

As many of us recall, Ohio used to assign ratings such as Effective, Continuous Improvement, or Academic Watch. But starting in fall 2013, Ohio has transitioned to more straightforward A–F school grades, a system used in thirteen other states.

It’s important to remember why Ohio adopted this grading system in the first place—and should maintain it moving forward.

  • It’s intuitive: As simple, intuitive tools for communicating academic results, almost all of us received A–F grades during our educational experiences. No other grading system—including no grades at all, as in a dashboard system—can match A–F grades on the basis of transparency to parents and the public.
  • It’s direct: Letter grades pull no punches: An A represents hard work and a job well done, while an F is a red flag that improvement is needed. Compared to other alternatives, A–F is the most forthright approach for providing feedback. Systems using descriptive ratings can be ambiguous. For example, Ohio formerly gave out a “Continuous Improvement” rating. To the general public, it communicated little about school quality—and could even wrongly suggest that a school was improving even though it had a higher rating the prior year.
  • It provides a helpful push to schools: At the end of the day, a transparent school accountability system should incentivize schools to improve outcomes for students. Rigorous research by Princeton’s Cecilia Rouse and colleagues show that student achievement in Florida schools rose as a result of tougher accountability policies, including the introduction of A–F report cards under Governor Jeb Bush. Though her analysis spans the early to mid-2000s, Florida students continue to register impressive gains on national exams as state leaders have stayed the course on accountability. Likewise, Ohio also needs to maintain a transparent system that can spur improvements and guard against complacency.

Well-designed report cards put student learning at the center and convey results in clear ways to Ohio’s parents and communities.

While my comments have been focused on report cards, we have a few other concerns with changes made in HB 591.

  • Student Growth: The bill proposes the creation of a new measure. It’s not clear at all how it would work. But we need to get this measure right because it’s one of the few measures that doesn’t correlate with socioeconomic status
  • Third Grade Reading: As reworked, this appears to give a free pass to high-wealth districts where most kids already read proficiently. Isn’t it most important to measure how well schools help struggling readers achieve success?
  • AP/IB Scores: By reporting the average score on AP and IB exams, the law could create an incentive to limit participation to only the very-highest-achieving students—and a disincentive to push kids to take more rigorous coursework. A better measure would report the percent of students in each school passing one or more exams
  • Similar School Comparisons: It’s conceptually fine to compare similar schools, but special care needs to be taken to not lower expectations for some students based on geography or demographics. High-poverty rural and urban students want to go to college and/or get good jobs just like low-poverty suburban students
  • CTE Report Card: HB 591 appears to preclude reporting the percent of students who pass state assessments. If it does, this is an extraordinarily bad message that suggests that CTE students don’t also need to have solid reading and math skills, in addition to their technical competencies.
  • Students not Taking State Assessments: The bill eliminates a provision in current law that a student not taking a state assessment receives zero points (out of five) for the purpose of computing a school’s performance index score. Although this may seem sensible, it could create an incentive for schools to counsel struggling students not to take state assessments. This would not only be bad for kids, but if it became commonplace, it could increase the likelihood that Ohio fails to meet the requirement in federal law that 95 percent of students must take the state assessment

With achievement in Ohio barely inching upwards, HB 591 makes some changes to law that would potentially negatively impact Ohio’s most disadvantaged students. Moreover, it would abandon a grading system that candidly depicts educational performance and offers the best chance of focusing our attention and resources on increasing student learning.

We agree that there is room to improve Ohio’s report cards. We need to strike a better balance between overall student achievement and student academic growth. We also need to ensure school data gives parents valuable information that they can use in choosing a school for their children. On this count, lawmakers have work ahead to revamp the state report card system. Unfortunately, HB 591 goes too far in the other direction in its effort to improve Ohio’s reporting mechanisms.

Thank you again for the opportunity to speak with you today.


[1] Aaron Churchill, Back to the Basics: A Plan to Simplify and Balance Ohio’s School Report Cards, Fordham Institute (December 2017), https://edexcellence.net/publications/back-to-the-basics-a-plan-to-simplify-and-balance-ohio%E2%80%99s-school-report-cards.

view

Testimony given before the House Education and Career Readiness Committee on Senate Bill 216—5/22/18

Chad L. Aldis
5.22.2018
Blog

NOTE: The Education and Career Readiness Committee of the Ohio House of Representatives today heard testimony on SB 216, a proposal that would make changes to the regulatory burden of Ohio’s public schools. Fordham’s Chad Aldis was a witness at this hearing and these are his written remarks.

Thank you, Chair Brenner, Vice Chair Slaby, Ranking Member Fedor, and House Education Committee members for giving me the opportunity to provide interested party testimony on Senate Bill 216.

My name is Chad Aldis, and I am the Vice President for Ohio Policy and Advocacy at the Thomas B. Fordham Institute. The Fordham Institute is an education-focused nonprofit that conducts research, analysis, and policy advocacy with offices in Columbus, Dayton, and Washington, D.C.

At Fordham, we’ve long believed that scrapping regulations that burden schools, have little to do with student learning, and restrict local flexibility and autonomy is a worthy undertaking. Over the past few years, Ohio legislators have taken small but commendable steps in providing regulatory relief for public schools.

Senate Bill 216 seeks to carry on this tradition, and it does so in a couple admirable ways. First, it provides flexibility around teacher licensing. Although licensing is viewed by many as a way to ensure minimum criteria around who teaches which courses, it also restricts the ability of school leaders to deploy staff in ways that meet organizational and student needs. SB 216 would allow superintendents to more effortlessly deploy teachers in grades and content areas in which they aren’t licensed, so long as certain conditions are met.

Second, the bill also makes a number of changes to Ohio’s teacher evaluation framework (OTES). In practice, many have found that OTES has created a tremendous amount of work and increased the testing load on students, without resulting in much differentiation of teacher performance. Therefore, it’s sensible to rework the framework to reduce testing and hopefully make it more helpful for educators.

The bill also does a few other worthy things of note that aren’t exactly deregulation. While maintaining the KRA for incoming kindergarten students (the as-introduced version eliminated it), the bill directs the Ohio Department of Education to recommend ways to streamline it. This is a valuable check to make sure the KRA is proving as useful as anticipated. On a separate front, SB 216 provides some cost relief for districts paying for College Credit Plus by requiring non-low-income parents to pay half of textbook costs. Finally, the legislation allows for our youngest students to take state assessments via paper and pencil. This seems reasonable if the goal is to figure out how much students know rather than how well they can use a keyboard.

Despite these promising provisions, SB 216’s changes to the minimum “n-size” creates a big problem. Current Ohio law requires student performance data to be disaggregated into various subgroup categories, including by grade level, race, and socioeconomic status. This data is only publicly reported when there are at least ten students in the subgroup. SB 216 increases Ohio’s n-size from ten to thirty students for both reporting and accountability purposes.

This is wrong for two reasons.

First, it means that smaller schools will be exempt from the state’s accountability system. According to documents published with Ohio’s ESSA plan[1], 20 percent of community schools have fewer than thirty students in tested grades. Among dropout prevention and recovery schools, nearly 40 percent have fewer than thirty students in tested grades. Other schools—like those in sparsely populated rural areas—could also fall into this category. If SB 216 is passed as is, families in these areas would have access to far less data than their neighbors and friends whose children attend other schools. This would also severely undermine Ohio’s accountability system.

Second, increasing the state’s n-size would conceal from public view disaggregated data on children who are most apt to get lost in our school systems. Subgroups who have been historically underserved and overlooked—minority students, students with disabilities, and English language learners, to name a few—would be excluded from the state’s accountability system. Not only does this walk the state backwards in terms of civil rights and data transparency, it also removes an important incentive for schools to give all students the support and interventions they need.

Here’s a chart from Ohio’s ESSA plan estimating how many students from various subgroups would be included in the reporting framework at various n-sizes. At an n-size of thirty, more than 20 percent of students with disabilities and almost 50 percent of Hispanic and English learners would be buried.

Overall, there’s a lot to like about SB 216. But the provision to increase the state’s n-size must be removed. If it’s not, the legislature will significantly weaken the state’s accountability system and increase the likelihood that the performance of some of Ohio’s most challenged subgroups will be hidden from public view.


[1] The ESSA calculation was conducted as part of the discussion regarding the AMO, or gap closing measure, for which Ohio previously set an n-size of thirty. The analysis conducted as a result would apply to other accountability measures if the n-size was increased from the current ten to thirty.

view

How Ohio can pave the way for a stronger, broader charter movement

Aaron Churchill
5.22.2018
Blog

Comparing Ohio K–12 education to other states helps us gauge the pace of progress, provides ideas on improvement, and gets us out of our local “bubble.” In a recent post, my colleague Chad Aldis examined Ohio and Florida’s NAEP results, finding the Buckeye State wanting in terms of gains over the past decade. Terry Ryan has also offered an insightful comparison of Ohio’s charter policies to Idaho’s. This piece follows a similar path and takes a look at Ohio’s charter landscape relative to Arizona’s.

Why the Grand Canyon State? For starters, Arizona has a significant charter enrollment of about 180,000 students, or 16 percent of public-school enrollment (Ohio has roughly 110,000, or 7 percent). Arizona charters are also producing some stellar results. As Matthew Ladner has repeatedly (and I mean repeatedly) shown, Arizona charters have posted high scores on NAEP—and for two years straight, US News & World Report placed several of them in its top-ten high schools in nation.

Let’s start by comparing a couple terrific maps that my Fordham colleagues produced in their recent Charter School Deserts report. Figure 1 displays the charter locations for the Cleveland metro area. What you’ll notice is that the vast majority of charters—the orange dots—are located within the city limits and largely in high-poverty neighborhoods (areas shaded in pink). Yet charters are noticeably absent from outlying high-poverty communities, such as Willoughby, Mayfield Heights, Solon, Strongsville, and Avon Lake.

Figure 1: Locations of charter schools in the Cleveland area
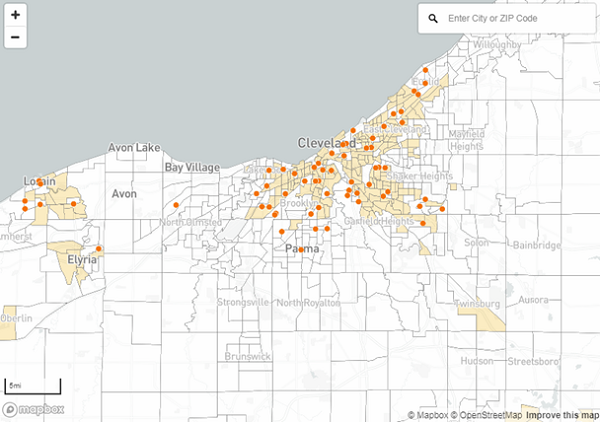
Locations of charter schools in the Cleveland area

Now let’s look at Phoenix. This figure shows a remarkably wide geographic distribution of charters—literally all over the map. They’re located in high-poverty, inner-city neighborhoods, as well as more affluent suburbs, like Litchfield Park, Surprise, Scottsdale, Gilbert, and Queen Creek. You could live almost anywhere in metro Phoenix and not be more than fifteen minutes from a charter school. That’s not the case if you happen to live in a Cleveland suburb.

Figure 2: Locations of charter schools in the Phoenix area
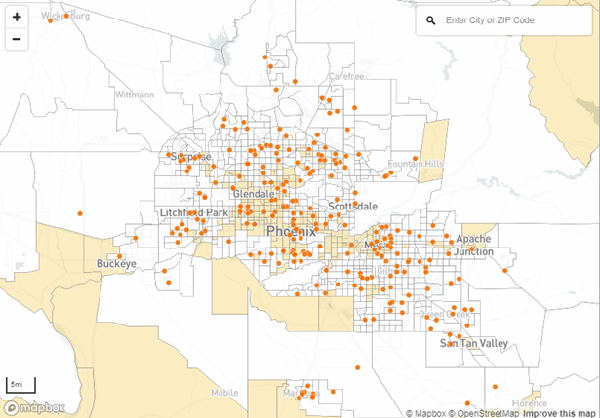
Locations of charter schools in the Phoenix area

These maps reflect very different policy approaches to charter-school formation. On the one hand, Arizona (and almost every other state) places no geographic limits on charter development, while Ohio places strict restrictions. Under Ohio law, startup charters are only allowed to open in “challenged” school districts, including those in Lucas County, the Big Eight, and other “low performing” districts, as defined in statute.[1] Today, startup charters are limited to just thirty-nine out of Ohio’s 610 districts. This explains the absence of charters in suburban Cleveland and almost anywhere else outside of Ohio’s urban core (see the full state map here).

Putting a geographic lid on charter formation does have some upsides. It has focused school developers’ attention on Ohio’s highest-poverty areas—locales where the educational needs are the greatest. Today, the Buckeye State is blessed with some terrific urban charters that are significantly improving students’ lives. It also avoids the political rancor that would likely follow a removal of suburban districts’ “territorial exclusive franchise” over public education, as Ted Kolderie once put it.

But with stronger charter accountability laws now in place, Ohio lawmakers should work to remove these geographic restrictions. Here’s why.

Suburban families are searching for different public school options. Although polls indicate that a majority of parents give their local public schools solid marks, about 40 percent are less satisfied, and a similar proportion think that more options would be beneficial. If Arizona is a bellwether for actual demand, a fair number of suburban parents are indeed seeking different schools for their children. For example, the Great Hearts charter network offers a distinctive classical liberal arts curriculum; today it has twenty-three schools across metro Phoenix and waitlists of some 20,000 students. Also in the Phoenix area are BASIS charters, which recently dominated the US News’s top-ten rankings. They’re proving to be a solid option for middle-class families seeking rigorous academics. It’s not just Arizona either. Recently, Wired magazine wrote on Design Tech High School in Silicon Valley, a charter school that, in close partnership with Oracle, focuses on technology, design, and entrepreneurship. Even in Ohio, some suburban families are trekking to quality charters like Columbus Preparatory Academy and Arts and College Preparatory Academy located just within big-city district limits. And as Charter Deserts so starkly reveals, many suburban families in Ohio are low-income households whose children are most in need of quality school options.

Charters in booming suburbs would provide options for families seeking smaller learning environments, especially in high school. I graduated from a mid-sized high school with a class of about 300 students. At times, I felt lost in a school of that size. But there are larger high schools than even that: In last fall’s enrollment counts, forty-two Ohio high schools reported senior classes of at least 400 students—many located in suburbs like Mason, Lakota, Kettering, and Olentangy. As these communities continue to grow and fill sprawling comprehensive high schools, some students may find it difficult to develop close relationships with teachers or classmates. Indeed, that may already be happening, as recent survey data found that public-school teenagers report weaker connections with adults working in their schools. Though many families and students will prefer large-school environments for a variety of reasons, others might want the smaller settings that charters often offer.

Charters in rural and small towns can foster close-knit communities of support. Thus far, we’ve concentrated on suburban locales, but the charter model can also provide opportunities for families in rural and small towns. Consider Ellen Belcher’s eye-opening profile of Sciotoville Elementary Academy that illustrates how one charter school in rural Appalachia goes the extra mile to serve its families and students. Other rural residents around the nation (including—you guessed it—Arizona) have used the charter model to maintain a cohesive community. Due to modest populations, small town and rural charters may never gain economies of scale, necessitating more creative ways to organize learning. But all communities, even smaller ones, should have the ability to form public schools that meet their local needs.

Allowing new charter school formation throughout Ohio would broaden support. National polling suggests that most people know little to nothing about charter schools. With almost no presence across massive tracts of Ohio, odds are that most Buckeye families know little about charters (alas, save perhaps for ECOT). This means Ohio charters have a narrow base of support, limited to those who have been well served by them and people who generally agree with the concept of school choice. To build a broader, stronger base of support, the next generation of Ohio charters will likely need to serve families and students from a wider range of communities.

* * *

The lesson from the Arizona is that families of all backgrounds and walks of life can benefit from charter schooling done well. Of course, simply removing Ohio’s geographic cap is no guarantee that charters will actually open in untouched parts of the state; it’ll take a supply-side response from educational and community leaders willing to start schools, as well as parents who enroll their children in them. But removing this legal barrier to entry is a necessary first step for charters to grow throughout all areas of Ohio.


[1] Districts themselves or regional Educational Service Centers may open a “conversion” charter school in non-challenged districts. In 2017–18, just 14 percent of Ohio charters are conversions.

view

2018 Teacher Prep Review: An examination of graduate and alternative teacher preparation programs

Jessica Poiner
6.4.2018
Blog

The National Council on Teacher Quality (NCTQ) recently added to their trove of teacher preparation evaluations with the 2018 Teacher Prep Review. This year’s study examines 567 traditional graduate, 129 alternative route, and eighteen residency programs across the U.S. (no undergraduate programs were examined). The difference between these programs rests largely on their approach to clinical training: traditional graduate programs require candidates to spend a semester or more student teaching in the classroom of an experienced educator; residencies place candidates in a mentor teacher’s classroom for up to a year; and alternative routes generally lack of student teaching, putting candidates in charge of their own classrooms almost immediately, what NCTQ refers to as an internship.

The report focuses on three key aspects of preparation programs: practice teaching, teacher knowledge, and admissions. To determine quality, reviewers examined whether programs aligned their requirements and instruction with scientific research in each of the three areas. Grades were assigned based on materials like course catalogs, syllabi, and observation forms. Each program was given the opportunity to review NCTQ’s findings and submit additional information.

The first area, practice teaching, evaluates whether programs provide candidates with adequate practice before licensure. NCTQ asserts that in order to offer high quality clinical experiences, programs must do two things.

First, they must actively identify and advocate for the assignment of mentor teachers who are effective instructors and have strong mentorship skills. Only 8 percent of traditional programs communicated these qualities to partner districts, while 50 percent of residency programs did so. Although about a quarter of alternative route programs also did this, very few actually arranged for candidates to spend time teaching alongside mentors.

Second, programs must require candidates’ supervisors to provide frequent observations and written feedback. Research shows that at least five observations during student teaching placement can make candidates more effective when they get their own classrooms. Residency programs stood out in this area: 72 percent conducted five or more observations. By comparison, only 43 percent of traditional graduate programs and 23 percent of alternative route programs did the same.

Within the practice section, NCTQ also evaluated programs based on their attention to classroom management—a notoriously difficult skill for novice teachers to master. To earn a grade of A or B, programs had to provide candidates with feedback on all, or nearly all, of the five classroom management strategies identified by the Institute for Education Science. Seventy-two percent of residencies and alternative route programs earned an A or B, compared to 49 percent of traditional graduate programs.

The second area, teacher knowledge, differentiates between subjects within elementary and secondary programs. In elementary mathematics, only 1 percent of traditional graduate programs earned an A for adequately covering critical math content, while twenty-three of twenty-eight alternative programs earned an A (including both residencies and alternative routes). Results for elementary reading were more mixed: 23 percent of graduate programs earned an A for teaching candidates the five key components of early reading instruction, while no alternative program earned an A.

In secondary programs, 76 percent of traditional graduate programs earned an A for ensuring candidates knew the science content they would be required to teach, while 42 percent of alternative routes earned that grade. In secondary social studies, 44 percent of traditional graduate programs earned an A compared to 25 percent of alternative programs. The report also investigated whether secondary programs required candidates to take a subject-specific methods course to prepare them to teach content. Seventy-seven percent of traditional graduate programs earned an A, compared to 42 percent of alternative routes.

The final area, admissions, is pretty straightforward: NCTQ evaluated programs based on their selectivity. An A grade was given to programs that required a 3.0 minimum GPA and either the submission of a graduate admissions test like the GRE or a rigorous audition. Eight percent of traditional graduate programs and 24 percent of alternative routes earned an A for screening their elementary and secondary candidates for academic caliber. An additional 7 percent of traditional programs earned an A+ because they maintained a level of racial diversity that was the same or greater than the institution itself (this “bonus” didn’t apply for alternative programs).

Based on the grades assigned in each of the three areas, NCTQ ranked all of the programs it studied. Six of the top ten elementary programs were alternative routes, as were six of the top ten secondary programs—results that should enhance the position of alternative route advocates. As with previous teacher prep reports, NCTQ found that most top-ranked traditional graduate programs were not located in elite and expensive schools. For programs interested in raising their grades, NCTQ also offers recommendations, including the importance of prescreening applicants for core content knowledge and focusing on better preparing teachers in the area of classroom management.

SOURCE: “2018 Teacher Prep Review,” National Council on Teacher Quality (April 2018).

view

Analyzing teacher tenure reform in Florida

Aaron Churchill
5.30.2018
Flypaper

Headlines this year have largely focused on teacher pay. But just a few years ago, a different set of teacher-policy issues were in the limelight, including teacher evaluation, tenure, and collective bargaining. At that time, states were pursuing aggressive reforms challenging decades-old laws that many viewed as more protective of educator jobs than promoting student learning. Though not all of these efforts yielded dramatic changes, Florida eliminated tenure for new teachers starting in July 2011. Instead of facing extensive and often costly dismissal procedures, this reform allows school leaders to remove low performers from the classroom by not renewing annual teacher contracts.

In theory, removing tenure in K–12 education can both positively and negatively affect student achievement. On the one hand, it may increase achievement as teachers are incentivized to focus more intently on student learning, knowing their job is on the line each year. Over the long haul, the overall quality of the educator workforce may improve if incompetent teachers are removed more swiftly and frequently than they are today. On the other hand, school leaders may be prone to poor judgment and erroneously dismiss some effective teachers. Proponents of tenure also suggest that eliminating tenure—a job perk—might dissuade talented individuals from entering the profession, though it may also attract less ambitious people seeking job protections.

A new analysis from Celeste Carruthers, David Figlio, and Tim Sass puts theory to the test, examining whether Florida’s new employment law affected student achievement in the two years immediately following enactment (2011–12 and 2012–13). To undertake the study, the researchers divided Florida schools based on their exposure to the changes in state law, defined in two ways: More exposed schools either employed more first-year teachers or evaluated more of their educators. The first definition supposes that schools hiring more rookies would be more sensitive to the elimination of tenure for newly hired teachers. The latter definition rests on the fact that Florida made renewing annual contracts subject to teacher evaluations (most teachers were evaluated in the period of this analysis). The analysts then use quasi-experimental methods to compare state test-score trajectories, controlling for students’ prior achievement, of pupils attending the more- versus less-exposed schools.

The study finds slight upticks in achievement related to tenure reforms, with gains mainly concentrated among Florida’s lowest-achieving students. Students attending more-exposed schools gained about 0.005 to 0.010 standard deviations—significant statistically but small from a practical standpoint, akin to about a half-point gain on the SAT, according to the analysts. When results are disaggregated by students’ baseline achievement, pupils in the lowest two quintiles generally posted gains that exceeded those of their higher-achieving counterparts. Carruthers, Figlio, and Sass characterize the findings as “limited and circumstantial evidence that SSA [Florida’s teacher reforms] slightly increased student test achievement in math and reading.” 

The somewhat inconclusive and short-run results are unlikely to settle contentious national debates over teacher tenure in K–12 education. But the study does offer some tantalizing evidence that eliminating tenure protections—and perhaps stopping the ugly dance of the lemons—may benefit disadvantaged students. Though tenure laws are likely to endure in Ohio and many other states, policymakers should at least reappraise whether making it almost impossible to dismiss low performers makes sense for children in need of an excellent education. 

SOURCE: Celeste Carruthers, David Figlio, and Tim Sass, “Did Tenure Reform in Florida Affect Student Test Scores?,” Brookings Institution (2018).

Fordham Logo

© 2026 The Thomas B. Fordham Institute
Privacy Policy
Usage Agreement

National

P.O. Box 110
Burke, VA 22009

202.223.5452

[email protected]

Ohio

P.O. Box 82291
Columbus, OH 43202

614.223.1580

[email protected]

Sponsorship

130 West Second Street, Suite 410
Dayton, Ohio 45402

937.227.3368

[email protected]
