
Public Education in the United States: A Nation Divided
This Phi Delta Kappan (PDK)/Gallup survey provides some tantalizing and provocative results regard public education
This Phi Delta Kappan (PDK)/Gallup survey provides some tantalizing and provocative results regard public education

Results from the umpty-fourth Phi Delta Kappan (PDK)/Gallup survey of Americans regarding public education released today, and they include some important revelations.
There’s more, of course, and you’ll want to dig in. Don’t expect survey results to settle anything but these are, at minimum, tantalizing and provocative.
William J. Bushaw and Shane J. Lopez
Public Education in the United States: A Nation Divided
Phi Delta Kappan, Gallup Organization
September 2012
If you have a high schooler at home, are a high school student yourself, or graduated from high school, you know these acronyms: SAT and ACT. These are, of course, the standardized tests juniors and seniors take in order to apply to college. In Ohio, over 92,000 college-seeking students took the ACT exam during the 2011-12 school year. Recently, ACT, Inc., the Iowa-based company that administers the exam, reported national and state-by-state results for the ACT test.
Ohio’s 2012 results, which can be found here, show that Buckeye State high-school students slightly outperformed their national peers in all tested subjects (English, reading, math, and science). The percent of Ohio students reaching the ACT benchmarks outpaced the national percentage by three (science) to six (reading) percentage points. Ohio’s ACT results, therefore, seem to correspond well to its NAEP results—another nationally administered exam—which also indicate that Ohio students do slightly better than the national average.
While Ohio’s above-average performance on ACT exams may trigger small celebrations, a closer examination of the data should cause concern. The more-rigorous Common Core academic standards in English language arts and math and its aligned assessment, the PARCC exam for Ohio, will arrive in the 2014-15 school year. If the PARCC exams mirror the ACT exams in content and difficulty—a strong possibility—Ohio may be in for a rude awakening when it reports how many of its students “pass” the PARCC exam.
For example, of Ohio’s ACT test takers, only 49 percent reached the ACT benchmark in math and 58 percent in reading. Therefore, if we consider the ACT test results as a proxy for the PARCC, Ohio’s eleventh-grade pass rate would fall a staggering 34 points in reading and 43 points in math, using its 2010-11 pass rate as the baseline.
Anyone with an interest in Ohio education should read through the ACT results. They shed light on how well Ohio does compared to peers across the country. And even more importantly, the ACT results shed some light on Ohio’s future under the Common Core and its aligned assessment, the PARCC exam. If the ACT is a reliable crystal ball for Ohio’s future under the PARCC, Ohio educators have a long way to go to prepare more students for the academic standards and exams of the future.
Normal 0 false false false EN-US X-NONE X-NONE /* Style Definitions */ table.MsoNormalTable {mso-style-name:"Table Normal"; mso-tstyle-rowband-size:0; mso-tstyle-colband-size:0; mso-style-noshow:yes; mso-style-priority:99; mso-style-parent:""; mso-padding-alt:0in 5.4pt 0in 5.4pt; mso-para-margin-top:0in; mso-para-margin-right:0in; mso-para-margin-bottom:10.0pt; mso-para-margin-left:0in; line-height:115%; mso-pagination:widow-orphan; font-size:11.0pt; font-family:"Calibri","sans-serif"; mso-ascii-font-family:Calibri; mso-ascii-theme-font:minor-latin; mso-hansi-font-family:Calibri; mso-hansi-theme-font:minor-latin; mso-bidi-font-family:"Times New Roman"; mso-bidi-theme-font:minor-bidi;}
Ohio: The Condition of College & Career Readiness, 2012
ACT, Inc.
August 2012
Grover Whitehurst and Sarah Whitfield of the Brookings Institution present a cost-benefit style analysis on whether stricter compulsory school attendance (CSA) laws improve high school graduation rates. Compulsory attendance laws vary state-to-state, with respect to the mandatory age of attendance—some require students to attend to sixteen, some seventeen, and others eighteen. In Ohio, the mandatory age of attendance is eighteen years old. But in this year’s State of the Union, the president recently argued for national unity on the age of CSA, stating that “every state [should] require that all students stay in high school until they graduate or turn 18.”
Is the president’s proposal good policy? When the authors analyzed the cost of CSA laws, they found that costs are low. Based on the authors’ analysis of 2009 research by Phillip Oreopoulos on the cost impact of compulsory attendance on disadvantaged youth, raising the CSA age to eighteen would not impose significant additional cost to the K-12 school system.
However, despite the low cost of CSA laws, benefits are low. Why? The authors find that, when comparing coded National Center for Education Statistics Averaged Freshman Graduation Rates from 1994-95 to 2008-09, states did not increase graduation rates after increasing the CSA age to eighteen. This means that there is no relationship between raising the CSA age and higher graduation rates.
Overall, the report suggests that even though a tougher CSA policy would not put a dent in issue it aims to fix, it could do some good to those students and parents who follow it. The authors present other interventions and policies, such as dropout prevention mentorship programs, that may be more effective in reducing high school dropout. Such programs address the underlying problems associated with dropping out; perhaps these deserve more attention and support than stricter CSA laws.
Compulsory School Attendance: What Research Says and Whit It Means for State Policy
By Grover J. “Russ” Whitehurst & Sarah Whitfield
Brown Center on Education Policy at Brookings
August 2012
Last week, Ohio’s State Board of Education voted unanimously to delay the release of annual school performance report cards as state officials investigate allegations of data-tampering. It came to light this summer that some Ohio school districts (Auditor of State Dave Yost is working to determine just how many) retroactively un-enrolled and re-enrolled truant or low-performing students in order to break the students’ enrollment records with the district. Those students’ test scores and attendance records would then not count toward the district’s overall report card rating because the students hadn’t been continuously enrolled from October to spring testing. (To be clear, there is no evidence yet that data-tampering was taking place in all, or even most, of the state’s 600+ districts, and there is conflicting opinion about whether the data changes were actually on the up and up.)
The state board’s decision was the right one. They simply cannot make public extensive data about school performance unless they have faith in the accuracy of that information. However, the decision has widespread ramifications for Ohio’s districts, schools, and students. There are a number of policy provisions triggered by the annual report cards and the test data they are based on that will now be put on hold while the state awaits Auditor Yost’s findings.
Five major accountability policies are affected:
Additionally, smaller decisions and policies are impacted. For example:
If the auditor winds down his investigation soon and confirmed data are released, this delay will have been more of a frustration than a serious impediment to various school improvement and accountability efforts (online guidance from ODE suggests this will be the case). But that’s a best-case scenario. What if the investigation lingers on, past the fall? Or worse, what if the auditor finds that some districts have been tampering with enrollment records for years? That could call into question more than a decade of school performance data and the state and local decisions that were made based on them.
Harder tests are coming to the Buckeye State.
Starting in the 2014-15 school year, Ohio will replace its current K-12 academic standards in math and English language arts, along with the aligned standardized tests, with the Common Core academic standards and their aligned tests. In Ohio, these exams will be the PARCC exams.
The Common Core standards will differ significantly from Ohio’s current academic standards in content, emphases, and cognitive demand.[1] These standards promise greater rigor in what students are expected to learn and how their learning is applied; therefore, we can also expect that the Common Core’s aligned assessments—again, the PARCC exams—will be more difficult.
How much harder should we expect the PARCC exams to be? Take a look for yourself.
Figure 1 shows two sample questions from Ohio’s current seventh-grade math exam. (The Ohio Department of Education provides practice tests, which are accessible via the source link below the figure.) The questions are relatively simple: the first question tests whether a student understands ratios; the second question tests whether a student understands a basic algebraic equation. Although I wouldn’t suggest that the questions are necessarily “easy” (it took me a few minutes to calculate the answers), they are straightforward—and are basically one-dimensional (testing one concept at a time).
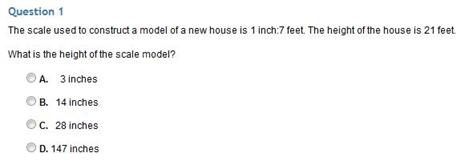

Figure 1: Sample test questions from practice exam, Ohio’s seventh grade math test. Source: Ohio Department of Education
Figure 2 shows two prototype problems for the seventh-grade math PARCC assessment. The first question comes directly from the PARCC consortium website, and the second comes from the Dana Center at the University of Texas at Austin website, an organization that is supporting the implementation of the Common Core (click on the source links underneath the figure).
The PARCC math questions are more complex than Ohio’s current test questions. The first question not only requires students to know what a ratio is, but also to apply their knowledge of ratios under different scenarios with varying levels of given information. In “Batch 1,” for example, the student is given two pieces of information, and in “Batch 2” the student is given only one piece of information. To fill in the missing pieces of both “Batch 1” and “Batch 2” problems, the student has to understand ratios, while also recognizing that the ratio of garlic to onion powder is identical. In the second question, students are asked to apply both their knowledge of a ratio (Δdistance/Δ time) and their understanding of how data is presented (in table and chart form).
These questions illustrate how the PARCC exam will require students to apply their knowledge in multi-dimensional ways, under differing circumstances, and using varying forms. It’s safe to say from these samples that PARCC test questions will be harder for students, requiring higher-order thinking and problem-solving skills.


Figure 2: Prototype test questions for PARCC seventh grade math test. Sources: The Charles A. Dana Center at the University of Texas at Austin and Agile Mind, Inc. and PARCC
Why worry about this harder test? For one, Ohio’s students, as a group, are already failing the state's current exam—an exam of less difficulty than what the PARCC exam promises to be. In 2011-12Ohio’s seventh graders, on average, answered twenty-four out of fifty math questions correctly. When the PARCC exams come online in two years, we should expect that Ohio students will answer even fewer questions correctly.
While the greater difficulty of the Common Core and the PARCC exams will challenge the next generation of Buckeye State students to perform at a world-class level, we should also expect that these new standards and aligned exams will cause a short-term shock. Ohio educators, administrators, and parents should all expect major drops in Ohio’s math and ELA proficiency rates (the number of students who “pass” the standardized test) in 2014-15. Therefore, it’s incumbent on these groups to acknowledge the facts—that Ohio students don’t test well even under its current, relatively-straightforward exam—while also preparing the public for the future under PARCC. Indeed, they must warn the public about the short-term pain when the 2014-15 test scores tumble. But they must also articulate the long-term benefit of the Common Core—that these higher standards will generate a better-educated, better-prepared group of Buckeye State students, armed with the skills to succeed in the careers of the future.
[1] Andrew Porter, et al., “Common Core Standards: The New U.S. Intended Curriculum,”Educational Researcher 40 (2011): 103-114.
Cincinnati is a Buckeye State leader when it comes to implementing the Common Core. This became clear yesterday during a conversation with national, state and local leaders in education, philanthropy and business. Cincinnati Public Schools is well into the nitty gritty of implementing the new Common Core academic standards in English Language Arts and mathematics. Teachers across the district are already receiving substantial support from the district, from the local teachers’ union and from the General Electric Foundation and other supporters on how to change their classroom practices to meet the higher and more rigorous academic standards that will be implemented across the state during the 2014-15 school year.
Nearly one hundred education stakeholders from across the Queen City heard from leaders in the Common Core effort. Mike Cohen, president of Achieve (one of the national organizations leading the multi-state standards initiative), shared information on the how states across the country are working to implement the Common Core. Bob Corcoran, President and Chairman of the GE Foundation, spoke of the global marketplace in which GE competes and of how students need to be prepared for the jobs and opportunities of the future. Corcoran shared his view that successful implementation of the Common Core is critical for the success of the country and its students. Former Massachusetts Commissioner of Education (and Fordham Board member) David Driscoll shared implementation lessons from the Massachusetts’ miracle, and pointed out that high standards and aligned assessments with rigorous cut scores are critical to improved student achievement, but even more important is adjusting what happens in the classrooms to meet these standards.
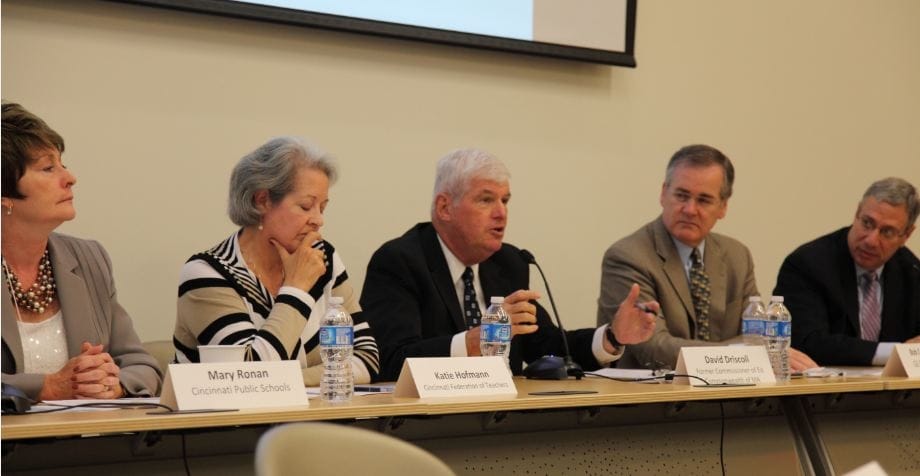
Panelists (from left to right): Cincinnati Public Schools Superintendent Mary Ronan, Cincinnati Federation of Teachers' Katie Hofmann, Fordham Board Member David Driscoll, GE Foundation's Bob Corcoran, Achieve's Mike Cohen.
The message throughout the conversation was clear: high school graduates in the United States are more often than not entering college unprepared for post-secondary work, requiring remediation that is both costly and prone to deter students from completing their degrees. Further, today’s job market requires some level of rigorous post-secondary work, and tomorrow’s will demand even more. Students must come out of high school able to read critically, reason critically, think logically, synthesize material and solve problems creatively. The consensus was that the Common Core Standards in math and English language arts (with science on the way as well) go a long way toward righting the ship of American education.
However, as Thomas B. Fordham Institute President Checker Finn pointed out, even the very best standards are not self-administering. “Implementation,” he said, “is a very big deal.”
Fortunately for Cincinnati they are ahead of the curve. A panel that included Cincinnati Public Schools Superintendent Mary Ronin, Katie Hofmann of the Cincinnati Federation of Teachers (along with Driscoll, Corcoran and Cohen), and acting State Superintendent of Public Instruction Michael Sawyers, spoke of local and state efforts to start preparing teachers, students and the larger community for the more rigorous Common Core. Ronan and Hoffman shared how they are working with Cincinnati teachers, principals and administrators to put into place plans and programs to help teachers integrate the Common Core into their curricula, instructional practices, learning materials and professional development. The state department is working with districts and charter schools across the state to help them, but it is clear some districts in Ohio are much further along than others. (All panelists agreed that the bar for student success will be much higher when the Common Core comes fully on-line and that is why it is critical to begin preparation now (or even better to have begun preparing last year!)
As Eve Bolton, President of the Cincinnati Public Schools Board of Education, put it, “This is as big as it gets in education.” She called on the support of everyone in the room – business, education, advocates, think tanks, parents, higher ed – to make certain that the will to move forward doesn’t waver as the going gets tough. Michael Sawyers pointed out that he firmly believes Ohio’s children can absolutely stand up and meet the higher standards, but he worries that the adults may get in the way when the going gets tough and test scores initially fall.
State Board of Education President Debe Terhar echoed these sentiments, and argued that the process of implementing the Common Core has to focus on the ultimate goal. Improving student achievement and giving children in Cincinnati and across the state a better shot at success. “Our children will succeed,” she said. “We must trust them with high standards.”
See additional coverage of the Common Core event at the Cincinnati Enquirer.
Results from the umpty-fourth Phi Delta Kappan (PDK)/Gallup survey of Americans regarding public education released today, and they include some important revelations.
There’s more, of course, and you’ll want to dig in. Don’t expect survey results to settle anything but these are, at minimum, tantalizing and provocative.
William J. Bushaw and Shane J. Lopez
Public Education in the United States: A Nation Divided
Phi Delta Kappan, Gallup Organization
September 2012
If you have a high schooler at home, are a high school student yourself, or graduated from high school, you know these acronyms: SAT and ACT. These are, of course, the standardized tests juniors and seniors take in order to apply to college. In Ohio, over 92,000 college-seeking students took the ACT exam during the 2011-12 school year. Recently, ACT, Inc., the Iowa-based company that administers the exam, reported national and state-by-state results for the ACT test.
Ohio’s 2012 results, which can be found here, show that Buckeye State high-school students slightly outperformed their national peers in all tested subjects (English, reading, math, and science). The percent of Ohio students reaching the ACT benchmarks outpaced the national percentage by three (science) to six (reading) percentage points. Ohio’s ACT results, therefore, seem to correspond well to its NAEP results—another nationally administered exam—which also indicate that Ohio students do slightly better than the national average.
While Ohio’s above-average performance on ACT exams may trigger small celebrations, a closer examination of the data should cause concern. The more-rigorous Common Core academic standards in English language arts and math and its aligned assessment, the PARCC exam for Ohio, will arrive in the 2014-15 school year. If the PARCC exams mirror the ACT exams in content and difficulty—a strong possibility—Ohio may be in for a rude awakening when it reports how many of its students “pass” the PARCC exam.
For example, of Ohio’s ACT test takers, only 49 percent reached the ACT benchmark in math and 58 percent in reading. Therefore, if we consider the ACT test results as a proxy for the PARCC, Ohio’s eleventh-grade pass rate would fall a staggering 34 points in reading and 43 points in math, using its 2010-11 pass rate as the baseline.
Anyone with an interest in Ohio education should read through the ACT results. They shed light on how well Ohio does compared to peers across the country. And even more importantly, the ACT results shed some light on Ohio’s future under the Common Core and its aligned assessment, the PARCC exam. If the ACT is a reliable crystal ball for Ohio’s future under the PARCC, Ohio educators have a long way to go to prepare more students for the academic standards and exams of the future.
Normal 0 false false false EN-US X-NONE X-NONE /* Style Definitions */ table.MsoNormalTable {mso-style-name:"Table Normal"; mso-tstyle-rowband-size:0; mso-tstyle-colband-size:0; mso-style-noshow:yes; mso-style-priority:99; mso-style-parent:""; mso-padding-alt:0in 5.4pt 0in 5.4pt; mso-para-margin-top:0in; mso-para-margin-right:0in; mso-para-margin-bottom:10.0pt; mso-para-margin-left:0in; line-height:115%; mso-pagination:widow-orphan; font-size:11.0pt; font-family:"Calibri","sans-serif"; mso-ascii-font-family:Calibri; mso-ascii-theme-font:minor-latin; mso-hansi-font-family:Calibri; mso-hansi-theme-font:minor-latin; mso-bidi-font-family:"Times New Roman"; mso-bidi-theme-font:minor-bidi;}
Ohio: The Condition of College & Career Readiness, 2012
ACT, Inc.
August 2012
Grover Whitehurst and Sarah Whitfield of the Brookings Institution present a cost-benefit style analysis on whether stricter compulsory school attendance (CSA) laws improve high school graduation rates. Compulsory attendance laws vary state-to-state, with respect to the mandatory age of attendance—some require students to attend to sixteen, some seventeen, and others eighteen. In Ohio, the mandatory age of attendance is eighteen years old. But in this year’s State of the Union, the president recently argued for national unity on the age of CSA, stating that “every state [should] require that all students stay in high school until they graduate or turn 18.”
Is the president’s proposal good policy? When the authors analyzed the cost of CSA laws, they found that costs are low. Based on the authors’ analysis of 2009 research by Phillip Oreopoulos on the cost impact of compulsory attendance on disadvantaged youth, raising the CSA age to eighteen would not impose significant additional cost to the K-12 school system.
However, despite the low cost of CSA laws, benefits are low. Why? The authors find that, when comparing coded National Center for Education Statistics Averaged Freshman Graduation Rates from 1994-95 to 2008-09, states did not increase graduation rates after increasing the CSA age to eighteen. This means that there is no relationship between raising the CSA age and higher graduation rates.
Overall, the report suggests that even though a tougher CSA policy would not put a dent in issue it aims to fix, it could do some good to those students and parents who follow it. The authors present other interventions and policies, such as dropout prevention mentorship programs, that may be more effective in reducing high school dropout. Such programs address the underlying problems associated with dropping out; perhaps these deserve more attention and support than stricter CSA laws.
Compulsory School Attendance: What Research Says and Whit It Means for State Policy
By Grover J. “Russ” Whitehurst & Sarah Whitfield
Brown Center on Education Policy at Brookings
August 2012