Mobile Navigation

  • National
    • Policy
      • High Expectations
      • Quality Choices
      • Personalized Pathways
    • Research
    • Commentary
      • Gadfly Newsletter
      • Flypaper Blog
    • Events
    • Scholars Program
  • Ohio
    • Policy
      • Priorities
      • Media & Testimony
    • Research
    • Commentary
      • Ohio Education Gadfly Biweekly
      • Ohio Gadfly Daily
  • Charter Authorizing
    • Application
    • Sponsored Schools
    • Resources
  • About
    • Mission
    • Board
    • Staff
    • Career
Home
Home
Advancing Educational Excellence

Main Navigation

  • National
  • Ohio
  • Charter Authorizing
  • About

Ohio Menu

  • Topics
    • Accountability & Testing
    • Advanced Education
    • Career & Technical Education
    • Charter Schools
    • Curriculum & Instruction
    • ESSA
    • Evidence-Based Learning
    • Governance
    • Personalized Learning
    • Private School Choice
    • School Finance
    • Standards
    • Teachers & School Leaders
  • Research
  • Policy
  • Commentary
    • Ohio Gadfly Newsletter
    • Ohio Gadfly Blog
    • Events

The Education Gadfly Weekly

Sign Up to Receive Fordham Updates

We'll send you quality research, commentary, analysis, and news on the education issues you care about.
Thank you for signing up!
Please check your email to confirm the subscription.

Ohio Education Gadfly Biweekly Volume 9, Number 23

Volume 9, Number 23
11.4.2015
11.4.2015

Ohio Education Gadfly Biweekly Volume 9, Number 23

Volume 9, Number 23
view
Quality Choices

Is Detente Possible? District-charter school relations in four cities

Whether you think the end game of the current “mixed economy” of district and charter schools should be an all-charter system (as in New Orleans) or a dual model (as in Washington D.C.), for the foreseeable future most cities are likely to continue with a blend of these two sectors. So we wanted to know: Can they peacefully co-exist? Can they do better than that?

Daniela Doyle, Christen Holly, Bryan C. Hassel 11.4.2015
NationalReport

Is Detente Possible? District-charter school relations in four cities

11.4.2015
Report

The opportunity gap: Extracurriculars and field trips aren’t just for fun

Jessica Poiner
11.3.2015
Blog

“Similar Students” measures: a flawed approach to school accountability

Vladimir Kogan
11.16.2015
Blog

Getting Lost While Trying to Follow the Money: Special Education Finance in Charter Schools

Jamie Davies O'Leary
11.11.2015
Blog

NCTQ’s state of the states 2015

Jessica Poiner
11.10.2015
Flypaper

Addressing the underperformance of Ohio’s online charter schools

Jamie Davies O'Leary
11.13.2015
Blog

Increasing the transparency of districts’ financial reports

Aaron Churchill
11.4.2015
Blog
view

The opportunity gap: Extracurriculars and field trips aren’t just for fun

Jessica Poiner 11.3.2015
Blog
view

“Similar Students” measures: a flawed approach to school accountability

Vladimir Kogan 11.16.2015
Blog
view

Getting Lost While Trying to Follow the Money: Special Education Finance in Charter Schools

Jamie Davies O'Leary 11.11.2015
Blog
view

NCTQ’s state of the states 2015

Jessica Poiner 11.10.2015
Flypaper
view

Addressing the underperformance of Ohio’s online charter schools

Jamie Davies O'Leary 11.13.2015
Blog
view

Increasing the transparency of districts’ financial reports

Aaron Churchill 11.4.2015
Blog
view

Is Detente Possible? District-charter school relations in four cities

11.4.2015
Report

Whether you think the end game of the current “mixed economy” of district and charter schools should be an all-charter system (as in New Orleans) or a dual model (as in Washington D.C.), for the foreseeable future most cities are likely to continue with a blend of these two sectors. So we wanted to know: Can they peacefully co-exist? Can they do better than that? Can they actually collaborate in the service of students, families and the public interest?

We teamed up with Public Impact to address these very questions, in the context of five cities that have among the best conditions for district-charter collaboration: Boston, Cleveland, Denver, the District of Columbia and Houston.*

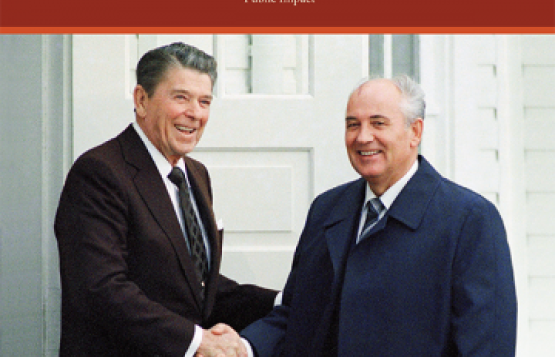
As we examined these evolving relationships, we found markedly different forms of engagement reminiscent of how international relations often play out. From Washington, D.C.’s “superpower summit” through Boston’s “protectionism under pressure,” the shifting district-charter interplay highlighted in this report may begin to point the way to a new world order in public education.

* Houston is a lesson in “Isolationism” as each sector mostly pursues its own course with minimal contact between them (so much so that we omitted it from full discussion in the report).

view

The opportunity gap: Extracurriculars and field trips aren’t just for fun

Jessica Poiner
11.3.2015
Blog

Schools have long been championed as places where we can level the playing field for low-income children. Unfortunately, that leveling doesn’t happen very often. Instead, schools have become the epicenter of not only the achievement gap, but also the opportunity gap— the inequitable distribution of resources and quality opportunities that contribute to the achievement gap.   

The authors of a recent Manhattan Institute (MI) policy brief discuss how income stagnation and inequality can limit opportunities for kids. Specifically, the brief references “the vastly different pathways available to students from different backgrounds.” To be fair, these gaps don’t exist just because of schools. But as Robert Putnam argues in his book Our Kids: The American Dream in Crisis, “Even if schools didn’t cause the growing opportunity gap—and there’s little evidence that they have—they might well be a prime place to fix it.”

So how do we get schools to take on the opportunity gap? What can we do? My colleague, Mike Petrilli, has tackled this question before and emphasizes the importance of social capital. Putnam, on the other hand, emphasizes monetary capital; he advocates allocating money to schools for the exclusive goal of ending the opportunity gap. He sums it up simply and wistfully: “I would love to have competitions among school districts for narrowing the opportunity gap.” One thing Mike and Putnam agree on is that extracurricular activities are a powerful tool for closing the opportunity gap. Putnam points out that extracurricular activities were “invented in American schools, by social reformers, for the purpose of training kids in what we now call soft skills.” Mike, meanwhile, suggests that the “secret sauce” of American education—what makes Americans innovative free thinkers—is what happens after school.   

Putnam takes the connection between schools and the opportunity gap to a new level when he mentions that schools are starting to charge students for extracurricular participation. We’ve seen this right here in Ohio: The Columbus Dispatch recently highlighted Ohio officials who want to end pay-to-play because of its burden on low-income families. When families can’t pay, kids miss out on opportunities that can significantly impact college admissions and academic performance. Even worse, some schools cease offering opportunities at all. In short, despite public awareness of the widening gap between rich and poor, opportunities that could help close that gap are either financially out of reach or becoming so for many families.

The kinds of opportunities Mike and Putnam advocate for don’t exclusively take place after school hours. Jay Greene has conducted research on the educational value of field trips and found that enriching field trips lead students to improve critical thinking, increase factual knowledge (which is really important for elementary kids), and improve non-academic skills such as historical empathy and tolerance. Most importantly, Greene’s findings indicate that the benefits are generally much larger for students from less advantaged backgrounds. Unfortunately, Greene also reported that culturally enriching field trips are in decline: A survey by the American Association of School Administrators found that more than half of schools eliminated planned field trips in 2010–11.

Reasons for the decline are complex and varied. One reason is finances. Greene points out that policymakers must consider “whether schools have the sufficient resources” to increase opportunities like tours of cultural institutions. Considering that many cash-strapped schools are also academically low-performing and often populated by low-income and minority students, this should set off warning bells for advocates of equity: Opportunities like field trips and extracurriculars can improve academic and non-academic skills for less advantaged students, but if families and schools can’t pay for them, are low-income kids just out of luck?

Education savings accounts (ESAs) could be a solution. When policymakers think about ESAs, Nevada's program probably comes to mind. The program, which was passed in 2015 and will launch in 2016, is the nation’s fifth ESA program but the first universal one. It allows parents with children enrolled in a public or charter school to apply for an ESA that contains a percentage of what the state pays for the child’s education. Parents can then use these funds for education-related expenses from approved organizations including private schools, virtual schools, and tutoring facilities. Parents can also purchase supplemental materials and special needs services, or pay for fees associated with tests like AP exams or the ACT and SAT.

Despite their potential, ESAs have been politically divisive. Considering recent battles over Common Core and charter schools, Ohio policymakers may be reluctant to start a battle over ESAs. But the Buckeye State doesn’t have to craft an ESA program identical to Nevada’s—in fact, Nevada’s program only allows ESAs to be used for after-school or summer activities if students opt out of public school. Ohio’s ESA, on the other hand, should allow students to stay enrolled in their traditional public or charter school and still receive funds via the ESA. A good model might be Ohio’s EdChoice Scholarship Program. Rather than using funds to pay for private school tuition, low-income families could apply for and receive assistance to mitigate the effects of the opportunity gap without ever leaving their public school. Funds that are housed in an ESA could be spent via a restricted-use debit card that applies only to state-approved programs. These programs don’t need to be limited to traditional museum tours or ending pay-to-play fees for athletics and clubs both inside and outside of school. There are plenty of other great experiences that kids can benefit from.

Instead of looking the other way as low-income families struggle to give their kids the same opportunities that affluent families take for granted, let’s address the need. After all, the beauty of challenging the opportunity gap isn’t just that low-income children may finally have equal opportunities. Taking on the opportunity gap also allows us to start attacking the achievement gap from a different angle—which just might help schools improve student achievement. 

view

“Similar Students” measures: a flawed approach to school accountability

Vladimir Kogan
11.16.2015
Blog

The school accountability movement is founded on the principles of transparency, high expectations, and the dissemination of accurate information about educational quality. While there is much to like about Ohio’s recently signed charter school reform legislation, one provision in the bill is at odds with all three of these ideas. As a result, it threatens to significantly undermine Ohio’s efforts to hold charter school operators and public school districts accountable for the achievement of the students they educate.

The provision I’m referring to requires the Ohio Department of Education (ODE) to create and evaluate a new “Similar Students” measure of academic achievement, based on a metric used in California. The final language of the legislation only called for a study of such a measure but there appears to be significant interest from legislators and stakeholder groups in formally incorporating it into Ohio’s existing school accountability system, particularly for charter schools. Once ODE completes its evaluation, this conversation is likely to intensify.

In a new analysis, I show why this would be a terrible idea. Using data from ODE and technical documentation from the California Charter Schools Association, I precisely replicate California’s methodology and create the Similar Students measure that Ohio is considering for its schools. In the analysis, I show that the measure has a number of fatal flaws: Not only does it fail to accurately identify high- and low-achieving schools, but it also artificially inflates the measured performance of Ohio charter schools while disadvantaging schools in Ohio’s big eight urban districts for reasons that have nothing to do with the quality of the education they provide to their students.

Before diving into these troubling results, it is useful to understand why policy makers might be interested in a Similar Students measure. The purpose of school performance designations (such as the letter grades published on Ohio’s school report cards) is to accurately assess the quality of the education being provided to students in the classroom. In reality, it is surprisingly hard to disentangle educational quality from all sorts of other factors that affect student achievement—including many factors over which schools have little control.

This is true because, in the first eighteen years of their lives, children spend only 10 percent of their time in the classroom. The experiences students have outside of the classroom—after school, on the weekends, and in the summers—impact their academic performance tremendously. Some kids have parents who read to them every night, help them with homework, and encourage them to live up to their potential. Although we might wish it were otherwise, many other children have parents who provide few of these forms of support, either because they can’t or don’t know how.

When we aggregate student achievement at the school or district level—by looking at proficiency rates, aggregate achievement indices, or metrics like graduation rates—the outcomes we observe reflect not only educational quality, but also all of these other determinants of academic achievement. Because many of the forces affecting student achievement are outside of school control, the proficiency measures used by some states to hold schools accountable effectively punish or reward them for the demographic composition of the students they serve, rather than the quality of the education provided in the classroom.

Fortunately, Ohio has recognized this problem and, since 2008, has also utilized a measure of academic “value-added,” which rewards schools not based on how well their students perform at one moment in time but instead on how much growth they make from one year to the next. The value-added approach addresses many—but not all—of the concerns about non-school influences on achievement, because a great deal of these factors effectively fall out when we focus on individual students’ growth instead of absolute achievement levels. (By relying in large part on students’ previous test scores, CREDO’s well-known “virtual twins” methodology does something comparable. It is therefore much more like the value-added approach than the Similar Students measure.)

The benefit of value added is that it accounts for any student-level factor that consistently affects student achievement, including aspects of their lives that would be impossible for us to measure otherwise.

The Similar Students measure tries to get at the same issue by using statistical modeling to make adjustments for demographic differences of students served by different schools. The problem with this approach, however, is that such adjustments can account only for observable differences between students. This might help us account for things such as student race or socioeconomic status, which is recorded in administrative data, but not for difficult-to-measure differences—such as individual motivation or parental involvement and support—that have as big of, if not bigger, an impact on student achievement.

It turns out that there is almost no relationship between student achievement growth, as measured by value added, and the scores we get using the Similar Students measure. Much of the difference between the two metrics is likely driven by such unobservable student characteristics. Overall, the correlation between the two is very low. As a result, many schools look stellar using the Similar Students measure even when, according to Ohio’s current metrics, they provide a crummy education. Similarly, many high-quality schools would get an F grade using the new measure.

The danger posed by such unobserved variables is particularly serious when applying demographic adjustments to charter schools. By definition, students who choose to attend charter schools are different from their peers who remain in traditional public schools. If these differences include difficult to measure factors such as motivation or parental involvement—and there is clear evidence that they do—using simple statistical adjustments to compare schools will do little to account for these differences and will artificially inflate the ratings calculated for charter schools using this method.

This is precisely what I find in Ohio when I compare the new Similar Students measure to the existing value-added scores published by ODE. Not only do charter schools look better on the Similar Students measure when compared to the typical Ohio school whose students make identical gains on the value-added metric, but urban district schools look far worse. This occurs because both charter school students and urban district school students differ from the pupils served by typical Ohio public schools in unobservable ways, and these differences systematically skew the Similar Students measure. In fact, the unearned “bonus” given to charter schools under this method equals roughly a full letter grade, while the “penalty” imposed on urban district schools totals roughly half a grade. (Could this be why some charter advocates are pushing for the measure?)

Let me stress that this doesn’t prove that Ohio charters systematically attract only the highest- performing students. Indeed, there is clear evidence that they tend to disproportionately serve demographically disadvantaged students. What it does suggest, however, is that Ohio charter school students tend to differ from their public school counterparts in a number of ways. Some of them are negatively correlated with student achievement (e.g., race, socioeconomic status), while others are positively correlated (e.g., parental involvement, motivation). The problem is that the Similar Students approach accounts only for the former while ignoring the latter, resulting in the artificial inflation of average charter school scores.

The consequences of incorporating the Similar Students measure into Ohio’s accountability system would be troubling on two counts. First, the new measure would incorrectly label many schools as being high- or low-achieving when, in fact, they are not. Second, it would create greater confusion among parents by adding yet another conflicting signal about the quality of their children’s schools they would need to reconcile for themselves. This undermines the promise of transparency.

Of course, I sympathize with many charter school operators who complain that Ohio’s current accountability framework unfairly punishes them—and most big urban school districts as well—for serving disadvantaged student populations. When it comes to Ohio’s school “performance index,” which is based on a snapshot of academic achievement, that is undoubtedly true. However, my analysis shows that simply switching to the Similar Students measure will not fix this problem. Instead, it will artificially boost the ratings of charter schools, producing school rankings that are no more informative or comparable between schools than the flawed achievement-based metrics Ohio mostly uses now. The best way to address these underlying concerns is to put greater weight on schools’ value-added grades, which currently play only a limited role in overall school evaluations, and also to expand this valuable measure to include more grade levels than are covered now. To be sure, the value-added approach is not without its own limitations, but it is by far the best and most informative measure we have available right now.

Vladimir Kogan is an assistant professor of political science at the Ohio State University.

view

Getting Lost While Trying to Follow the Money: Special Education Finance in Charter Schools

Jamie Davies O'Leary
11.11.2015
Blog

This brief by the National Alliance for Public Charter Schools and the National Center for Special Education in Charter Schools offers “the most comprehensive analysis to date” on what is a very convoluted topic—special education funding in charter schools. Drawing from a review of state funding laws, websites, documents, and interviews with key stakeholders, the authors present their findings in several parts.

First, “Getting Lost While Trying to Follow the Money” (apt title, by the way) offers a primer on special education funding. Understanding the flow of special education dollars requires a grasp of overlapping federal, state, and local funding streams, which the brief outlines effectively. Readers learn the history of IDEA Part B, the ins and outs of the “maintenance of effort” requirements, and instances in which schools can qualify for Medicaid reimbursements. The report also describes the types of state funding formulas used. Ohio is one of nineteen states with a weighted funding formula (i.e., special education funding is based on the severity of a student’s disability, type of placement, and overall need). The vast majority of charters can’t access local funds (in Ohio, a handful in Cleveland can). Thus, if their special education costs exceed the categorical amount they receive from the state, they lack the flexibility afforded to district schools—which can draw from local reserves, raise taxes, or reallocate their budget accordingly. 

The brief also explains how a charter school’s legal identity (as its own Local Education Agency or not) has major implications on its finances and programs. Charter schools that operate as their own LEA (as in Ohio) experience greater curricular, HR, and programmatic freedoms when it comes to spending state and federal special education dollars, but they are still “wholly responsible” for giving students with disabilities the full array of services (including a continuum of alternative placements) expected from a multi-school district. To mitigate the associated costs, some states give charters access to special support funds from the state, or allow them to contract with school districts, other service providers, or join a special education cooperative (which more states should allow). In some states, having a “partial” link to an LEA is beneficial for exactly this reason—the full cost of educating students falls to the charter school, except for students requiring private or residential placement. On the flip side, charters that operate as part of an LEA benefit from shared services like transportation or legal counsel, and if a student requires private placement, the financial cost falls on the district. But they are restricted programmatically and financially.

Next, the report takes a deep-dive look at three states (Arizona, Colorado, and New York). These case studies are meant to illustrate the complexity of each state’s special education funding landscape, the impact of charters’ legal status (LEA or non-LEA), and the particulars of various formula models. It also explores the various strengths and weaknesses associated with each, though the authors readily admit that “absent a more in-depth and representative analysis…we cannot assess which approach to funding special education in charter schools is ‘best.’” Finally, the brief provides a comprehensive fifty-state summary of special education funding practices and laws in the context of each state’s charter landscape.

The authors are absolutely correct when writing that “a high level of technical expertise is needed” by schools and advocates alike to ensure that charter schools receive their share of federal, state, and local dollars for special education. This brief is a valuable contribution toward building that expertise.

Source: Lauren Morando Rhim, Paul O’Neill, Amy Ruck, Kathryn Huber, Sivan Tuchman, “Getting Lost While Trying to Follow the Money: Special Education Finance in Charter Schools,” National Alliance for Public Charter Schools and National Center for Special Education in Charter Schools (November 2015).  

view

NCTQ’s state of the states 2015

Jessica Poiner
11.10.2015
Flypaper

In spite of some well-publicized controversies, performance-based teacher evaluations have maintained a strong presence in most states. A new report from the National Council on Teacher Quality (NCTQ) examines the policy landscape of teacher and principal evaluations, as well as various states’ successes in using evaluations to inform teacher practice and administrative decisions.

As of 2015, twenty-seven states require annual evaluations for all teachers, and forty-five require annual evaluations for all new, probationary teachers. Forty-three states require objective measures of student achievement to be included in teacher evaluations; seventeen use student growth as the “preponderant” criterion for evaluations; and an additional eighteen count growth measures as “significant” criteria.

Despite these new policies, however, a “troubling pattern” lingers on from the evaluation systems of yesteryear: The overwhelming majority of teachers are still labeled as “effective” or “highly effective.” NCTQ notes this could be the result of several factors, including the fact that few states utilize multiple observations and multiple observers—which is problematic because many principals are either unable or unwilling to “make distinctions about teacher skills” when conducting observations. In addition, Student Learning Objectives (SLOs)—which are required or allowed by twenty-two states—fail to effectively differentiate teacher performance. According to NCTQ, these objectives are often a poor measure of teacher performance because teachers either lack the data and assessment training to select the best achievement goals or are indirectly incentivized to set low goals. (The other problem is that managers won’t give bad reviews to staffers they can’t fire, which is still the case in the vast majority of schools.)

Thirty-four states also require annual evaluations for all principals. Despite this majority, many principal evaluation policies lack important features. For instance, policies in twenty-two states do not identify who is responsible for conducting principal evaluations, and only twenty-seven states actually require principal evaluators to receive training. Most worrisome, there are ten states where teachers—but not principals—can be dismissed based on evaluation results. Given the monumental importance of effective school leadership, it’s inexcusable that only teachers would be held accountable for their evaluation ratings.

NCTQ labels Delaware, Florida, and Louisiana as “leading the nation” in using evaluations to shape teacher training, professional development, improvement planning, compensation, and accountability.

NCTQ rounds out its report with some solid recommendations, which include aligning teacher and principal evaluations and focusing on incentivizing states that are willing to implement evaluation policies rather than “twisting the arms” of unwilling states. The federal government ought to keep these suggestions in mind when it considers doling out the next round of federal waivers. 

SOURCE:  Kathryn M. Doherty and Sandi Jacobs, “State of the States 2015: Evaluating Teaching, Leading, and Learning,” The National Council on Teacher Quality (November 2015).

view

Addressing the underperformance of Ohio’s online charter schools

Jamie Davies O'Leary
11.13.2015
Blog

CREDO’s national study of online charter schools has prompted even ardent supporters to call for “tough changes” in how they are regulated. Released in tandem with Mathematica’s survey of operational practices of e-schools and an analysis of state online charter policy by the Center for Reinventing Public Education (CRPE), the findings showed that Ohio online charter students learned seventy-nine fewer days in reading and 144 fewer days in math. (Read our analysis of the study here.)

Where does Ohio stand in its current regulation of online schools (which serve nearly one-third of the state’s entire charter school population)? And what can policy makers—and the e-schools themselves—do to ensure that students are better served? Let’s examine each question in turn.

Ohio’s recent steps to regulate e-schools

After an eight-year moratorium, Ohio lifted its ban on e-schools and allowed three new ones to open in 2013. The state regulates their expansion more tightly than charter schools broadly. In deciding who may open, the Ohio Department of Education examines both the track record of the operator and sponsor of each proposed e-school. Statute allows five e-schools to open each year, but the department may elect to approve fewer (or none) depending on application quality.  

Growth of Ohio’s existing online charter schools has also been modestly capped. Starting last school year, legislation (HB 59) capped enrollment growth for e-schools—to 15 percent for schools with three thousand students or greater and to 25 percent for schools with fewer. Brand new e-schools are limited to an enrollment of one thousand students in their first year. To our knowledge, none of Ohio’s twelve statewide e-schools have reached the enrollment caps.

Lawmakers and Governor Kasich deserve credit for jumpstarting more changes in the recently passed HB 2, Ohio’s charter law overhaul. Under the legislation, e-schools must offer a student orientation course, provide opportunities for parent-teacher conferences, and communicate with parents about student performance and progress on a “periodic basis” throughout the school year. Sponsors will be required to monitor and ensure a school’s compliance with the online learning standards to which they are subject. Finally, e-schools must keep an accurate record of each student’s participation in learning opportunities throughout the day.

These new regulations place the Buckeye State ahead of the game compared to many states. But given the number of e-students who appear to be struggling and the magnitude of their underperformance, the newly enacted policies may not be enough.

What else can be done?

Ohio should consider four ideas that would alter how e-schools operate and ultimately promote better student outcomes.  

First, as recommended by the National Alliance for Public Charter Schools (NAPCS) and CRPE, the state should think creatively about how it funds e-schools. Ohio can learn from the nascent efforts of four states (Florida, Minnesota, New Hampshire, and Utah) experimenting with performance-based or “completion-based” funding. Each defines completion differently—it can mean passing an exam, demonstrating mastery, earning course credit, etc.—and two of the states even allow e-schools to receive partial payment for partial completion. Of course, this would open up new cans of worms with respect to how we define “mastery.” But this shouldn’t be a deterrent, as a working definition of mastery would have other valuable policy uses. (Florida uses performance-based funding for all charter schools, including brick-and-mortar ones, and is moving that way for all of its public schools.) Ohio should explore a funding model that rewards e-schools for retaining students and moving them successfully along their academic paths. This would motivate e-schools to recruit students for whom virtual schooling is a good fit. It would also help the state’s better e-schools distinguish themselves, adding competitive pressure on low-performers.

Second (also suggested by NAPCS and CRPE), Ohio should explore the elimination of open enrollment requirements and instead allow e-schools to restrict their program—in a legally permissible way—to students likely to be successful in a virtual environment. As CRPE argues in its report, “Online schools are not for all students, yet state policies tend to limit online charter schools’ ability to restrict enrollment or impose admission requirements.” A flexible learning environment enables some students to thrive. But others need the structure and face-to-face time not afforded by a virtual school, which often provides “less live teacher contact time in a week” than what traditional schools provide in a single day. These students should not be allowed to waste a valuable year of learning in a school that’s a bad fit.

Some evidence in Ohio suggests that the longer students are enrolled in their e-schools, the better students perform. CREDO also highlights the fact that students who enroll in an online charter school tend to become more mobile later in their school careers, changing schools 2–3 times more than their peers. All of this underscores the importance of enabling e-schools to restrict their enrollment to students likely to be successful and stay put.

Third, e-schools serving students in grades K–12 might consider creating separate dropout prevention and recovery programs for their most at-risk high schoolers. It’s often argued by e-schools that many virtual students face unique barriers and are thus fundamentally different from their traditional (and even brick-and-mortar charter) peers. Plain Dealer reporter Patrick O’Donnell explored the question last month, noting that “the little data that’s available shows hardly any difference demographically between online kids and students at schools across the state.” But at least one statewide e-school (the Electronic School of Tomorrow) offered self-reported data about its student population for that article. Among ECOT’s high schoolers, one-fifth have children of their own, one-third work in order to support families, and nearly all are considered to be at risk of dropping out. Though anecdotal, these statistics raise valid questions about the extent to which some e-students resemble those enrolled in a dropout recovery program.

Any Local Education Agency (LEA) is allowed to apply to the Ohio Department of Education to seek a dropout prevention and recovery program (DPRP) waiver. Dropout recovery programs allow at-risk students between the ages of sixteen and twenty-one to complete a competency-based instructional program in lieu of the Ohio core curriculum. Schools applying for dropout recovery status must certify that their enrolled students are at least one grade level behind (their cohort age groups) and/or “experience crises that significantly interfere with their academic progress such that they are prevented from continuing their traditional programs.”

Four of Ohio’s twelve statewide e-schools are already dropout recoveries. While the current accountability framework for DPRPs leaves much to be desired[i], they do provide a vital last resort option for students. Ohio e-schools liken their student populations to those served by DPRPs, claiming that it’s unjust to compare their students to any other kind of student. The pathway to alternative accountability is already paved for them.

Finally, while CREDO’s online charter study followed objectively rigorous methodology in how it matched comparison students, critics still cry foul. If e-schools take issue with the current metrics painting them in a poor light (not just CREDO data, but the state’s value-added scores), they should work with legislators to create the conditions for a gold standard study rather than pursuing flawed and inferior measures like the California Similar Students Measure, a simple regression model that uses school-level data instead of more robust and accurate student-level data. Ohio could create a lottery system for admission to e-schools such that three-quarters of applicants would be admitted. This would create the conditions for a randomized control study that could track and compare e-students with those who applied but didn’t attend and would go a long way toward showing e-schools’ impact on students—for better or for worse. It’s likely that e-schools would oppose this, of course, both for obvious financial reasons and a bit of righteous indignation at the thought of turning away students who might legitimately need another option. But until and unless e-schools can help the state develop good data to track their students’ success, we must rely on value-added scores and studies like the one produced by CREDO. To say there’s no fair way to evaluate their students at all is a cop-out.

To be clear, e-schools have a rightful place in the charter school landscape. But they should serve students as well or better than the schools their students would otherwise attend. To improve e-school quality, Ohio should experiment with how it funds and rewards them, as well as enabling them to craft enrollment policies that draw in students with a decent chance at success. The e-schools themselves have a role to play in accumulating better student data. For those claiming they educate students at the very margins and therefore deserve a reprieve from heightened scrutiny, they should be reminded that there’s a waiver and an alternative accountability system set up for that very purpose. For students who are already disadvantaged, the loss of a year’s learning might sound a death knell for their educational careers. If anything, this should raise our expectations of e-schools, not lower them.  


[i] A DPRP can receive a rating of “meets standards” and avoid closure if for two consecutive years, it improves its graduation rates and percentage of students passing assessments by 10 percent. For programs with graduation and passage rates in the single digits, that’s just too low of a bar.

view

Increasing the transparency of districts’ financial reports

Aaron Churchill
11.4.2015
Blog

School finance systems are complicated, often controversial, and subject to a certain amount of speculation. Are public schools “overfunded” or “underfunded”? Are they wasting precious taxpayer dollars or putting them to effective use? From which sources are they receiving their funds, and what strings might be attached? Are our public institutions on solid financial footing, or are they in dire straits?

These are fundamental questions that parents and taxpayers have every right to ask and to which they’re owed clear answers. One crucial disclosure is a district’s statement of revenues and expenditures—akin to a business’s income and expense statement. This report describes how a district raised revenue and how it spent those funds during the past fiscal year.

But you may be surprised to learn that the state revenues received and transferred to charters are also included in a district’s financial statement. You wouldn’t know it by simply looking at the statement: Consider, for example, the statement of revenues and expenditures for Cincinnati City Schools in the figure below.

[[{"fid":"115044","view_mode":"default","fields":{"format":"default"},"type":"media","attributes":{"style":"height: 596px; width: 500px;","class":"media-element file-default"},"link_text":null}]]

You’ll notice that the presentation doesn’t clearly display the $57 million received to educate Cincinnati charter students; nor is it evident how the district posts the corresponding expense. (The $57 million figure is retrieved from Cincinnati’s district payment report for FY 2014.)

But the funding to educate Cincinnati children attending charters is actually rolled into the district’s “Intergovernmental – State” revenue line item (highlighted). Meanwhile, the corresponding expenditure for the charter transfer is reported as a “Regular Instruction” expense—also highlighted. (The expense falls under Uniform School Accounting System code 001-1190-478, “Payments to a Community School.”)

One might ask: Is a proper disclosure made in the district’s notes to the financial statements? Unfortunately, nowhere is there even a footnote on the revenue and expenditure related to charters. Worth noting is that other financial statements lack documentation on the charter pass-through as well (see here and here for Columbus and Dayton’s respective financials).

A district isn’t responsible for educating charter students, so in my view, it’s misleading to include the charter revenue and expense on districts’ financial statements without any disclosure. Some might incorrectly conclude, for example, that Cincinnati Public Schools raises over $616 million to educate CPS students when, in fact, it’s more like $540 million (including the charter and other choice-related transfers). The present accounting method could also be used to artificially inflate a district’s “Regular Instruction” expenditures as a fraction of overall expenses, which might be desirable if someone wanted to show that more dollars are being used on instruction and not administration.

To be clear, districts are not at fault. Rather, it’s an issue with state policy whereby charters—entities that are generally[1] legally separate from a district—receive funding via district pass-through. So here’s a modest proposal to improve financial transparency on the district reporting side: State policy makers should require districts to include at least a financial footnote affirming the inclusion of charter transfer funds in their statements of revenues and expenditures (and the amount). This would greatly aid readers’ interpretation of the financial data.

Perhaps it is also time to determine a way to move charter schools off the district accounting books altogether. As public benefit organizations independent of district administration and oversight, charters shouldn’t distort our view of district finances. Budget analysts, taxpayers, and citizens deserve a clear view of the share of public funding being spent in the classroom, a calculation that cannot be done easily so long as the charter pass-through is booked entirely as an instructional expense. By removing the charter funds passing through the district, taxpayers and citizens can review district documents confident that they truly reflect its financial position.


[1] District-sponsored charters could be considered a “component unit” of a school district; for example, Patriot Preparatory Academy, sponsored by Reynoldsburg School District, is a component unit of the district.

Fordham Logo

© 2026 The Thomas B. Fordham Institute
Privacy Policy
Usage Agreement

National

P.O. Box 110
Burke, VA 22009

202.223.5452

[email protected]

Ohio

P.O. Box 82291
Columbus, OH 43202

614.223.1580

[email protected]

Sponsorship

130 West Second Street, Suite 410
Dayton, Ohio 45402

937.227.3368

[email protected]