Mobile Navigation

  • National
    • Policy
      • High Expectations
      • Quality Choices
      • Personalized Pathways
    • Research
    • Commentary
      • Gadfly Newsletter
      • Flypaper Blog
    • Events
    • Scholars Program
  • Ohio
    • Policy
      • Priorities
      • Media & Testimony
    • Research
    • Commentary
      • Ohio Education Gadfly Biweekly
      • Ohio Gadfly Daily
  • Charter Authorizing
    • Application
    • Sponsored Schools
    • Resources
  • About
    • Mission
    • Board
    • Staff
    • Career
Home
Home
Advancing Educational Excellence

Main Navigation

  • National
  • Ohio
  • Charter Authorizing
  • About

Ohio Menu

  • Topics
    • Accountability & Testing
    • Advanced Education
    • Career & Technical Education
    • Charter Schools
    • Curriculum & Instruction
    • ESSA
    • Evidence-Based Learning
    • Governance
    • Personalized Learning
    • Private School Choice
    • School Finance
    • Standards
    • Teachers & School Leaders
  • Research
  • Policy
  • Commentary
    • Ohio Gadfly Newsletter
    • Ohio Gadfly Blog
    • Events

The Education Gadfly Weekly

Sign Up to Receive Fordham Updates

We'll send you quality research, commentary, analysis, and news on the education issues you care about.
Thank you for signing up!
Please check your email to confirm the subscription.

Ohio Education Gadfly Biweekly--Volume 11, Number 25

Volume 11, Number 25
11.20.2017
11.20.2017

Ohio Education Gadfly Biweekly--Volume 11, Number 25

Volume 11, Number 25
view

Will next year’s school ratings be a disaster?

Next September, Ohio districts and schools will receive an overall grade on their report cards. While the Buckeye State has generated overall ratings before—using labels such as “effective” or “academic watch”—this will be the first time Ohio assigns an overall A-F grade.

Aaron Churchill 11.20.2017
OhioBlog

Will next year’s school ratings be a disaster?

Aaron Churchill
11.20.2017
Blog

Ohio’s latest charter sponsor ratings are out: What do the numbers mean?

Jamie Davies O'Leary
11.17.2017
Blog

Columbus City Schools: Money matters

Jeff Murray
11.9.2017
Blog

Closing the achievement gap is a collective effort

Jeff Murray
11.15.2017
Flypaper

You’re invited to a discussion of school choice and collaborative solutions for education success

Ohio Education Gadfly
11.20.2017
Blog

Youngstown takes a wrong turn on teacher evaluations

Jessica Poiner
11.13.2017
Blog

What CER’s parent power report card gets wrong about Ohio

Jamie Davies O'Leary
11.15.2017
Blog
view

Ohio’s latest charter sponsor ratings are out: What do the numbers mean?

Jamie Davies O'Leary 11.17.2017
Blog
view

Columbus City Schools: Money matters

Jeff Murray 11.9.2017
Blog
view

Closing the achievement gap is a collective effort

Jeff Murray 11.15.2017
Flypaper
view

You’re invited to a discussion of school choice and collaborative solutions for education success

Ohio Education Gadfly 11.20.2017
Blog
view

Youngstown takes a wrong turn on teacher evaluations

Jessica Poiner 11.13.2017
Blog
view

What CER’s parent power report card gets wrong about Ohio

Jamie Davies O'Leary 11.15.2017
Blog
view

Will next year’s school ratings be a disaster?

Aaron Churchill
11.20.2017
Blog

Next September, Ohio districts and schools will receive an overall grade on their report cards. While the Buckeye State has generated overall ratings before—using labels such as “effective” or “academic watch”—this will be the first time Ohio assigns an overall A-F grade. Akin to our final GPAs in high school or college, these summative ratings roll up the disparate parts of Ohio’s report cards into a single, user-friendly rating. This letter grade will stand out: Parents, the public, and media will inevitably focus their attention on it.

Because of its prominence, the way Ohio determines these grades is of utmost importance. Ideally, policymakers would create a formula (i.e., weighting system) that strikes a balance between indicators of pupil achievement and growth over time. This ensures that schools are held responsible both for meeting proficiency, graduation, and post-secondary readiness targets—the achievement side of the equation—as well as boosting the year-to-year growth of all students, including those who have not yet met achievement goals or advanced pupils who easily surpass them. Given true differences in school quality, summative ratings should reflect those variations. For instance, a system that assigns D’s or F’s to the vast majority of schools is not helpful to families or taxpayers; the same could be said for a system that hands out all A’s and B’s.

When it comes to the grading formula that Ohio is slated to use next year, questions loom. Does it properly balance achievement and growth? How are the results likely to shake out? Will it effectively separate the wheat from the chaff?

Overall grading formula

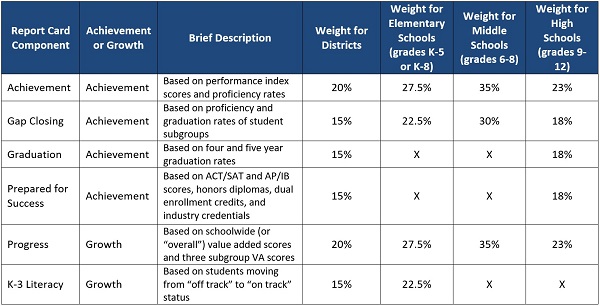
The table below shows the six major components of report cards and the weight they carry in the grading formula that Ohio is set to deploy next year. These weights are applied in a points-based system—schools earn points based on their component ratings—to calculate a weighted average. This average is then translated into the summative grades.

As you can see, the formula for districts, high schools, and middle schools favors achievement-based components relative to growth (65 to 35 percent for districts and middle schools and 77 to 23 percent for high schools). For elementary schools, the weight is split 50-50, though it’s worth noting that K-3 Literacy is not a “growth for all students” measure. Unlike Progress, this component does not capture the learning gains (or losses) of all students; in fact, the growth of vast numbers of pupils are not accounted for, as it simply considers whether lower-achieving students jump from “off track” to “on track” status from one year to the next on diagnostic reading exams. For this reason, K-3 Literacy should be viewed as a crude growth measure with limited usefulness.

Table 1: Ohio’s current components and summative ratings’ weighting system

AC Franklin County grades table 1

Source: Ohio Department of Education. More details on each component can be found here.

Forecasting overall ratings in Franklin County

To explore whether this weighting system will yield differentiation in school performance, I analyze data from the 2016-17 school year to predict what the distribution of “overall” grades would have been this year had they been generated. The data examined include only schools in Franklin County—Columbus and its suburbs—an area with a mix of high- and low-poverty schools.  

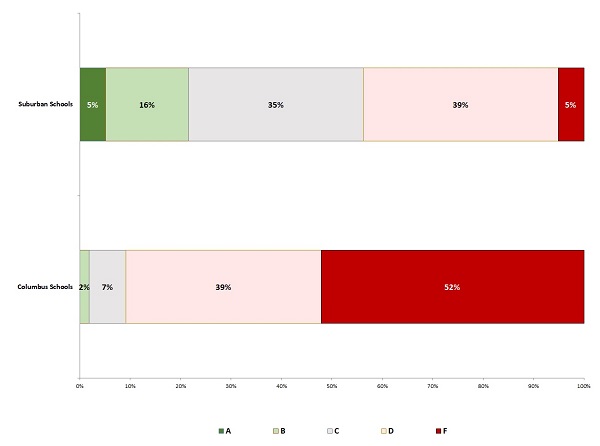
The chart below indicates that higher-poverty schools in Columbus—including both district and charter—are likely to fare poorly under the planned grading formula: About nine in ten Columbus schools receive overall D’s or F’s, results that are similar to what I reported earlier this year, at that time based on 2015-16 data. The systematically poor ratings for high-poverty schools reflects the emphasis of achievement-based measures in the grading formula; as numerous analyses have found, high-poverty schools tend to struggle on measures such as proficiency and graduation rates due in part to factors outside of their control, most notably students’ family incomes. High-growth Columbus schools—including three recently awarded ODE’s coveted Momentum Award—are assigned mediocre to abysmal overall ratings.

Suburban schools fare better in this system relative to city schools—not unexpected given the higher average achievement levels, and higher socio-economic status, of pupils residing in these wealthier communities. As the chart below indicates, roughly one in five suburban schools is likely to receive A’s and B’s, ratings that are virtually non-existent among Columbus schools. But even suburban schools have some reason to worry: Upwards of 40 percent could receive D’s or F’s under Ohio’s current system. This pattern is partly explained by the fact that several of the report-card components are generally harsh on all schools, not just high-poverty ones. For instance, the majority of Ohio districts received D’s or F’s on the Achievement, Gap Closing, and Prepared for Success components in 2016-17 (54, 63, and 68 percent respectively). Of course, there are also pockets of less affluent suburban schools around Columbus that face challenges similar to city schools; they also receive lower ratings under this system.

Chart 1: Predicted distribution of overall grades under Ohio’s current summative rating formula

AC Franklin County grades chart 1

Note: Columbus schools include district and any Franklin County charter school (almost all are located within the jurisdiction of Columbus); the number of Columbus schools is 163. Suburban schools include those operated by the following districts: Bexley, Canal Winchester, Dublin, Gahanna-Jefferson, Grandview Heights, Groveport-Madison, Hamilton, Hilliard, New Albany, Reynoldsburg, South-Western, Upper Arlington, Westerville, Whitehall, and Worthington. The number of these schools is 176. The same schools and counts apply to Chart 2.

The two major takeaways from this chart are the following. First, the summative rating formula that Ohio is on the verge of implementing won’t differentiate between good and bad high-poverty schools—it lumps almost all of them into the D or F camp. These overall ratings will fail to offer families living in these communities any meaningful way to identify quality schools. Second, it may even lead to ratings for suburban schools that may not be believable to many middle-class families (bear in mind that 40 percent could be rated D’s or F’s, and only 20 percent could get A’s or B’s). This could lead to uproar and mistrust over the report cards themselves, rather than being seen as productive, reliable tools that help to inform decision making.

A different approach

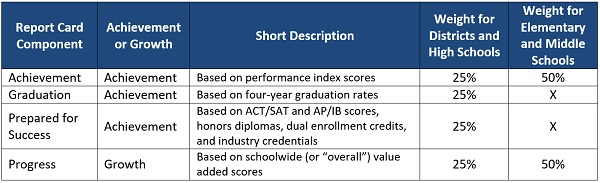
What if legislators implemented a more balanced grading formula? What would the results look like then? Table 2 displays a “back to the basics” version of Ohio’s school report cards that contains the key metrics of academic performance, along with a straightforward set of weights. In a forthcoming Fordham report—stay tuned in early December—I make a case that legislators should adopt this type of report-card framework and formula, save for one difference related to gauging schools’ subgroup performance.[1] This formula would provide 50-50 weighting on growth and achievement for elementary and middle schools; for districts and high schools, the weights would tilt more towards achievement-based metrics, as readiness metrics come to the forefront (75 percent weight).[2]

Table 2: Revised components and summative ratings’ weighting system

AC Franklin Count grades

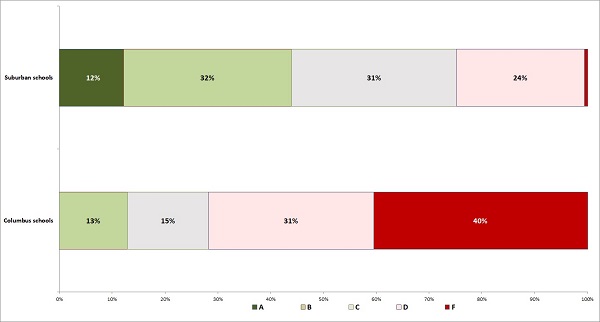
Chart 2 offers a view of how the rating distribution would shift for Franklin County schools under this alternative approach. Notice the greater differentiation among the higher-poverty Columbus schools, largely driven by the increased weight on the Progress component for elementary and middle schools. To be sure, a majority of schools still receive D’s or F’s—they struggle on both achievement and growth metrics—but roughly one in four schools earn B’s or C’s. This formula recognizes that these are schools producing strong growth, though their students still need to make up ground to meet achievement goals. As for suburban schools, they also receive somewhat higher grades. My analysis suggests that about 40 percent could receive A’s or B’s, with roughly a quarter in the two lowest categories. This may be a better reflection of the performance of middle-class schools; most are doing decently to exceptionally well, while a handful are having difficulty spurring student growth.

Chart 2: Predicted distribution of overall grades under a revised summative rating formula

AC Franklin County Grades

* * *

In the coming months, Ohio legislators should review and make important changes to state law that would result in improved school ratings. A simple, properly balanced report card strengthens public understanding of report cards themselves and produces results that better differentiate school quality—particularly in Ohio’s highest poverty communities. Revamping report cards in this way seems like a win all around for Ohio families, educators, and students.


[1] In the report, I suggest overhauling Gap Closing to create a balanced growth-achievement component based on subgroups’ value added and PI scores. Because this restructuring requires data that are not presently available (e.g., African American students’ value added scores), I do not include this proposed component in these calculations.

[2] With the inclusion of a restructured Gap Closing component, the weight on growth measures for high schools and districts would increase to 30 percent; there would be no difference for middle and elementary schools.

view

Ohio’s latest charter sponsor ratings are out: What do the numbers mean?

Jamie Davies O'Leary
11.17.2017
Blog

Yesterday, the Ohio Department of Education released the second round of charter sponsor (a.k.a. authorizer) ratings. The Plain Dealer’s Patrick O’Donnell was quick out of the gate in noticing overall improvements from last year’s ratings (“Cleveland and other charter school sponsors doing a better job, new ratings show”) highlighting the Cleveland district’s own improvement as well as a high-level look at the grades. The Dispatch took a more negative spin, “Sponsors of 10 Ohio charter schools receive ‘poor’ ratings from state,” emphasizing that nearly half of sponsors earned a rating of Poor or Ineffective.

Indeed, 21 of 45 sponsors were deemed ineffective or poor for 2016-17. Yet the Dispatch omits the fact that all but six of these low-rated sponsors (one career technical center, one non-profit, and four educational service centers) were traditional public school districts. The story also took pains to note that those earning effectives did so “despite poor achievement ratings for some or many of their schools.” This is true, but it overlooks the reality that high-poverty schools across the board (charter or district) have struggled and will continue to struggle on achievement metrics until the state makes student growth over time a bigger part of its calculations.

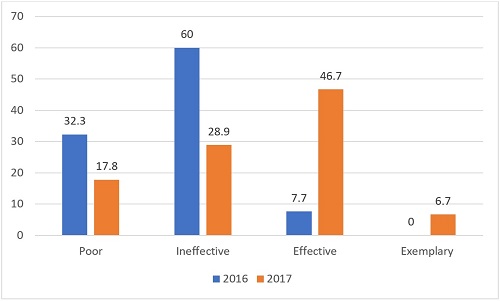
It might be helpful to back up for a moment and take a deeper looking at the sub-ratings and how scores have changed from 2016 to 2017. Bear in mind that sponsors are evaluated along three components: the academic performance of their schools; compliance with state laws and regulations; and adherence to best practices. These equally weighted components generate an overall sponsor rating of Poor, Ineffective, Effective, or Exemplary.

For starters, the number of Ohio sponsors shrunk dramatically in just one year—from sixty-five to forty-five. This is a result of last year’s ratings handing out Poor ratings to many sponsors, mostly traditional public school districts overseeing just one school. Sponsors receiving this rating were required to close, pending an appeal (two districts’ appeals are still being decided).

The ratings for the remaining sponsors also improved dramatically (see Graph 1). Over half (53 percent) of today’s sponsors earned an Effective or Exemplary score, compared to just 8 percent last year. The number of sponsors receiving the lowest rating (Poor) also fell by almost half.

Graph 1: Ohio overall sponsor ratings (as a percent of sponsors): 2016 v. 2017

JO sponsor ratings graph

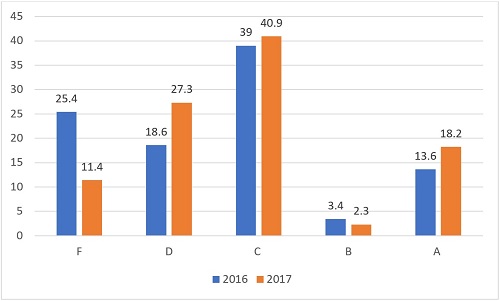
What’s behind this dramatic shift in sponsor ratings in just one year? The below graphs provide context and tell a more nuanced story. The percent of sponsors whose schools’ academic performance earned “F” grades fell by 14 percentage points (See Graph 2). Those earning A grades also increased slightly. This is likely due to the fact that many of last year’s lowest-scoring sponsors have since gone out of business (as, in some cases, did their schools).

At the same time, the numbers as a whole haven’t shifted dramatically. This makes sense given the fact that the academic portion of the sponsor evaluation system relies heavily on achievement metrics (rather than growth), which are highly correlated with student demographics. Statewide performance scores didn’t shift much this year, and neither did the demographics at the charter schools for whom sponsors are graded—so it’s not surprising that these scores didn’t jump all over the board. Also bear in mind that sponsors are tasked primarily with oversight; they don’t operate schools or make day-to-day decisions on their behalf. Yes, they are responsible for quality, but this shows up primarily in decisions around who to open to begin with, and how/whether to intervene or close poor performers. These are longer-term decisions that won’t have a huge impact on year-to-year academic scores.

Graph 2: Percent of Ohio sponsors earning A-F ratings on academics: 2016 v. 2017

JO sponsor ratings graph

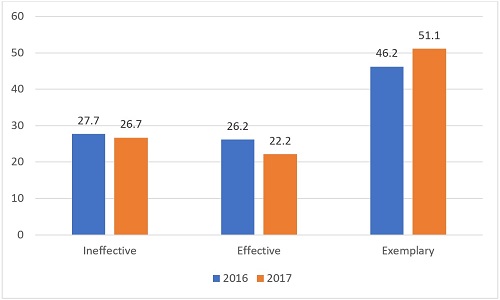
Scores on the compliance section of the review also improved modestly, with slightly more sponsors earning an exemplary on this section and slightly fewer deemed ineffective (Graph 3).

Graph 3: Ohio sponsor compliance scores (as a %): 2016 v. 2017

JO sponsor ratings

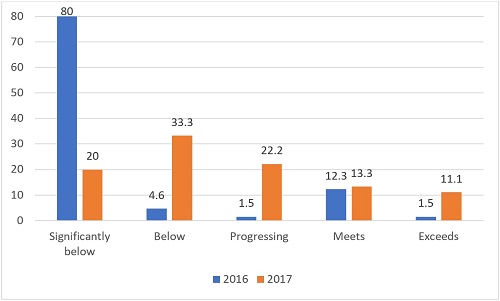
The huge jump occurs in the “quality practices” section of the review (Graph 4). Last year, four of five sponsors were significantly below standards on how well they adhered to best practices of quality oversight; this year, just one in five earned the bottom-most rating. Many more sponsors are meeting standards or exceeding them.

Graph 4: Ohio sponsor quality scores (as a %): 2016 v. 2017

JO sponsor ratings graph

The dramatic changes from last year to this year suggest that a few things are happening.

  1. Across the board, the sponsorship sector is improving—in terms of overall scores, quality practices, and the exit of twenty sponsors (almost all of which were traditional school districts).
  2. Recent shifts point to more districts no longer wanting to sponsor charters. Ohio has always had a relatively large number of sponsors, yet many are/were school districts that got into the business in order to oversee one school (often a dropout recovery school). It would make sense that these groups might score poorly on compliance and quality practices—the primary role of authorizers—because as districts they are not designed nor are they typically staffed in order to support this work. (Cleveland Metropolitan School District is an exception, along with perhaps a few others.)
  3. There is more than meets the eye on academic scores. Many otherwise high-rated sponsors had schools that earned relatively low academic performance scores. This is especially true for sponsors with general education charters; dropout recovery charters have an easier time “meeting standards” on an alternative accountability system, and thus delivering the equivalent of a “C” back to their sponsor. This does not suggest, as some would imply, that those general education charter schools necessarily have a “poor record in educating students.” It instead suggests that any high-poverty school—district or charter—earns and will continue to earn lower performance ratings than low-poverty schools until the state changes its calculation for its overall grades.

Governor Kasich, the legislature, and the sponsor community itself deserve credit for improvements in the last two years. Still, there is work to be done to improve the way sponsors are held accountable for the performance of their schools—placing more emphasis on growth measures (as the legislature attempted to do in the state budget before Governor Kasich vetoed it)—as well as reducing the endless paperwork that sponsors must collect and report to demonstrate their own compliance with laws and regulations (we suggest a randomized audit-like process). And lest we forget, while strong oversight is necessary, it’s also insufficient to ensure that more excellent, innovative schools can expand to meet the needs of the many Ohio students and families who need better options. 

view

Columbus City Schools: Money matters

Jeff Murray
11.9.2017
Blog

In the last week, central Ohioans got an interesting look at how Columbus City Schools deals with its taxpayer-provided finances and assets, courtesy of two stories from the Columbus Dispatch.

First up, the district got some rare kudos following what is believed to be a hacking scare. The details are still unclear but it seems that direct deposit data for dozens of district employees were accessed and changed by an outside entity in an attempt to divert payroll money into prepaid debit cards. Scary stuff! And the district deserves props for safeguarding its employees by requiring that the first paycheck after a direct deposit change must be a hard copy one. But for that accounting control, many thousands of taxpayer dollars would have been lost.

I’m sure it was a pain for employees who count on the regularity and ease of a direct deposit, but it could have been far worse. Neither the district nor its employees lost a dime and the change was noticed as quickly as possible.

Unfortunately, not every dime of Columbus City Schools’ funding is equally valued.

Another Dispatch report detailed how an effort by the district to sell a surplus school building to The Ohio State University has foundered due to what is termed “bureaucracy” by the school board president. The financial aspects of the story stand in stark contrast to the above caution and care.

Ohio law requires that charter schools be given right of first refusal on buying any excess school buildings, but only when sold via public auction. The deal with the university—a “state entity”—meant Columbus could skip the public auction and work solely with the preselected buyer. This kept a pesky competitor from grabbing a purpose-built school facility, rare as hen’s teeth for charter schools. However, it also resulted in a lowball price (30 percent below the previously appraised value) that will likely net the district hundreds of thousands of dollars less than they would have received through competitive bidding. Did any charter school want the building? Were they willing to offer a higher price? Who knows? Comparative data provided by the Dispatch shows that recent competitively bid properties, including a bus compound, sold for a collective 16 percent above appraised value.

Luckily for the district, OSU was also willing to negotiate with Columbus to hammer out what they might or might not do with the building, according to the Dispatch story, including not reselling it to a charter school. If you’re starting to think that keeping out the competition was of more concern to the district than maximizing the return on taxpayers’ investment, you may be on to something.

Finally, the agreement included an earnest fee payment of $25,000 to Columbus City Schools should the closing on the sale not happen by a prescribed date. When the aforementioned bureaucracy reared its head, that deadline was exceeded. Luckily for the university, the district was not serious about the earnest money, or even the deadline. Even if the check had been cut, the school board president reported, he probably wouldn’t have cashed it anyway. Despite all of this, the deal is still ongoing with neither urgency nor deadline. Here’s hoping there are more questions to come about the implications of this sale to the district and its residents.

So, kudos to Columbus City Schools for safeguarding thousands of dollars of its employees’ taxpayer-funded payroll money (which was probably insured against theft anyway) and brickbats to them for squandering hundreds of thousands of dollars in taxpayer-funded assets with a janky deal intended mainly to screw over charter schools.

This Columbus taxpayer is glad to have more proof of where the district’s fiscal priorities lie.

view

Closing the achievement gap is a collective effort

Jeff Murray
11.15.2017
Flypaper

“Collective efficacy” is the sense among group members that they have the capability to organize and execute the actions required to achieve their most important goals. Researchers have, for twenty years, tested it as a key factor in explaining performance differences among groups attempting the same task in areas such as healthcare and manufacturing. The literature on collective efficacy in K–12 education is new and growing, spearheaded largely by Roger D. Goddard of The Ohio State University. A new report by a group of researchers led by Dr. Goddard seeks to unite quantitative and qualitative data on the subject.

The quantitative portion of the analysis was fairly straightforward, looking at the math achievement levels of 13,472 fourth- and fifth-grade students on a mandatory assessment given annually in one large district in Texas. Change between the two years of scores was the sole academic measure utilized and researchers looked at achievement gaps between different school buildings and between black and white students. A measure of collective efficacy was derived using a twelve-item survey, which was administered to 2,041 teachers. The survey rated teachers’ level of agreement on a scale of one to five with statements such as, “Teachers are here to get through to the most difficult students.” Statements addressed each individual’s perception of group competence and “analysis of the teaching task.” A single collective efficacy score for each building was made up of the mean of the twelve aggregated item scores.

After controlling for student and school demographic characteristics, a one standard deviation increase in collective efficacy was associated with a 0.1 standard deviation increase in mathematics achievement—a small but statistically significant predictor. More striking was the finding that a one standard deviation increase in collective efficacy was associated with a 50 percent reduction in the math achievement gap between black and white students. In short, schools whose teachers believe they have the capability of raising the math achievement of their students—all of their students—will apparently do so.

There are, of course, caveats to the findings, including the large Latino student population in the district whose achievement levels were not specifically analyzed (remember: the study looked only at the white-black achievement gap), and the difference between teaching math and less skills-based subjects like English and social studies, which might resist even the highest levels of collective efficacy. But we have seen evidence that odder things than teachers’ belief in themselves, and their students, may influence achievement.

Convinced of the positive connection between collective efficacy and math achievement, the researchers also sought to understand the factors that influenced schools’ relative collective efficacy scores. This was accomplished by way of teacher focus groups held at six selected schools—split evenly between high and low collective efficacy scores. The responses were nuanced and wide-ranging, but collective efficacy scores were most strongly correlated with perceptions of support from school leadership and perceptions of peers’ own efficacy and positive role modeling. The more supportive school leaders were perceived to be of teacher collaboration, instructional improvement, etc., the higher a school’s collective efficacy score. And the more teachers described their peers as having a sustained focus on instructional improvement (increased instructional time, no excuses for low performance, etc.), the higher a school’s collective efficacy score.

Collective efficacy is about “organizing and executing the courses of action required” for a group to achieve a goal. If the group has the sense that they are capable, research seems to indicate that they are more likely to succeed at organizing and executing. If that is true, then it seems like collective teambuilding is probably a better sign of success than, say,, collective bargaining.

SOURCE: Roger D. Goddard, Linda Skrla, and Serena J. Salloum, “The Role of Collective Efficacy in Closing Student Achievement Gaps: A Mixed Methods Study of School Leadership for Excellence and Equity,” Journal of Education for Students Placed at Risk (October, 2017).

view

You’re invited to a discussion of school choice and collaborative solutions for education success

Ohio Education Gadfly
11.20.2017
Blog

For too long, the topic of school choice in Ohio has been divisive and polarizing. You are invited to attend a thoughtful and substantive discussion of school choice with experienced leaders from across the state. This effort to find common ground and collaborative solutions in support of students promises to be a great evening. We hope you can attend.

Tuesday, December 5, 2017

6:00 to 8:00 pm

Capital University Law School

Room 229, 303 E. Broad Street

Downtown Columbus

Panelists: Stephen O. Dyer (Innovation Ohio), Andy Boy (United Schools Network), Mary Ronan (former Superintendent of Cincinnati City Schools), and Chad L. Aldis (Thomas B. Fordham Institute),.

Refreshments will be served, and there will be time reserved for you to ask questions and gain insight into school choice efforts currently underway across Ohio.

We hope you’ll join the conversation.

Tickets are free but we urge you to register today.

view

Youngstown takes a wrong turn on teacher evaluations

Jessica Poiner
11.13.2017
Blog

Youngstown City School’s CEO Krish Mohip recently announced significant changes to how his district will evaluate its teachers.

Under Mohip’s new system, 50 percent of a teacher’s evaluation score will be based on classroom observations of instruction and 50 percent will be based on student growth. So far so good; on its face, this is identical to the state’s original evaluation framework. The difference between the two is how student growth is measured. Under the state’s system, value added scores and vendor assessments are supplemented, when needed based upon the subject and grade level taught, by locally determined measures. Mohip, on the other hand, plans to evaluate individual teachers based on the entire district’s progress using only one student growth measure—shared attribution.

For those who are unfamiliar, shared attribution is the practice of attributing value added scores—which are largely determined by ELA and math state tests in grades 4-8—to every teacher in a school or district, regardless of the subject or grade level a teacher teaches. For instance, since a sixth grade social studies teacher does not have a state test that produces value added results, her student growth score would be based on how her students performed on their reading and math tests. Under Mohip’s plan, each teacher would be held accountable for the entire district’s progress—meaning that the aforementioned sixth grade social studies teacher wouldn’t just be evaluated based on her sixth grade students’ ELA and math scores, but on the value added scores of every student in the entire district. 

This is nuts.

In theory, I suppose, shared attribution could inspire a collective, “we’re all in this together” culture. Unfortunately, that’s unlikely to happen. Despite what the word “shared” implies, shared attribution doesn’t actually ensure that teachers share accountability—just that core teachers with value added data are responsible for the evaluation scores of non-core teachers (like gym, art, and music) in addition to their own. Statewide, the number of teachers who can actually be evaluated based on value added measures is small: only 20 percent of Ohio teachers are able to be measured using the state assessment either in whole or in part.[1] If that percentage holds in Youngstown, that means the majority of Youngstown teachers will have no significant influence over half of their final evaluation rating.

Evaluating anyone, including teachers, on results they can’t directly influence is unfair. So why force it onto an entire district? Mohip asserts that it will help “motivate teachers to help students in areas in which they need the most support—even if that’s not their subject.” But the logic behind this statement is faulty at best and ignorant at worst. For starters, it elevates reading and math above all other subjects. While no one would argue that learning to read and do math is not a vital part of a student’s education, so too is the content learned in science, social studies, and other classes. Recent reports and studies of other states have shown that adopting a high-quality, content-rich curriculum may be the best step toward improving reading and math achievement—arguably far better than expecting non-core teachers to teach content they aren’t experts in. Mohip would be better off focusing on what teachers are teaching and how they are teaching it rather than trying to force art and gym teachers to teach reading strategies.

But a narrowed curriculum isn’t the only negative consequence of this new evaluation system. Historically, teacher evaluations have aimed to accomplish two goals: holding teachers accountable for their performance and helping them get better through feedback. Mohip mentioned both of these aspects when unveiling his new system—he noted that he wants to provide teachers with more “feedback that’s going to be able to help [them] become a better teacher” and that the system is about “holding everyone accountable.”

But the new system does neither of these things. District-wide shared attribution risks inflating or deflating the overall evaluation score of teachers depending on whether the district does well on value added. Half of all teachers’ score will be exactly the same—which could potentially hide meaningful differences between teachers.

As for professional development: The feedback teachers receive will come from classroom observations, not from student growth measures. Unfortunately, other than a vague reference to creating the “professional development path every teacher needs,” there’s no clear indication of how the district plans to improve the feedback that teachers previously received under the state evaluation system. This is particularly problematic considering that the state’s rubric and template for professional growth plans are woefully insufficient. The Educator Standards Board recently made some solid recommendations for how to improve the rubric, but those recommendations are virtually useless to Mohip and his staff, since they suggest incorporating content-specific student growth measures into the rubric and getting rid of shared attribution altogether.

Most folks would agree that Youngstown’s long history of poor academic performance is more than enough reason for Mohip to incorporate some drastic policy changes. As CEO, he is certainly entitled by law to do so. But great power also brings great responsibility, and Mohip’s chief responsibility is to improve the education provided to the thousands of students in his district. Plenty of research has shown that quality teaching is necessary for students’ achievement and positive labor market outcomes, so Mohip is right to focus on teacher accountability and improvement. But he’s wrong to assume that shared attribution is the best way to accomplish these goals. Not only will it fail to effectively and fairly differentiate teachers, it will also lead to a narrow focus on reading and math at the expense of other subjects—a move that the students in Youngstown just can’t afford.


[1] The 20 percent is made up of teachers whose scores are fully made up of value added measures (6 percent) and teachers whose scores are partially made up of value added measures (14 percent).

view

What CER’s parent power report card gets wrong about Ohio

Jamie Davies O'Leary
11.15.2017
Blog

Since 2012, the Center for Education Reform (CER) has released an annual “parent power index,”—a scorecard for states as well as an interactive tool for parents “to discover whether their state affords them power over their child’s education—and if not, what they can do to get it.”

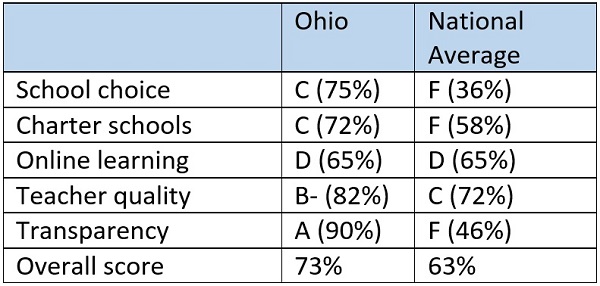
The index rates states along five categories: (private) school choice, charter schools, online learning, teacher quality, and transparency—and then provides an overall score. It also offers quick facts on statewide achievement (NAEP proficiency and ACT scores) and student enrollment. On the latest index, Ohio ranks eleventh in the nation and scores well above the national average in all but one of the five categories.

How Ohio performed on the 2017 Parent Power Index
JO parent power 1 chart 1

The question CER seeks to answer is an incredibly important one: how much power do parents really have? Unfortunately, this particular index is only partially accurate. Let’s take a quick look at what it got right, where it went askew, and how this local Ohioan views parent power in the Buckeye state.

School choice

The index gave Ohio a C for school choice, listing out its four statewide scholarship programs and one specific to Cleveland. Given the size, strength, and history of Ohio’s scholarship programs, Ohio should have scored higher.

For starters, Ohio has 60,000 EdChoice scholarships available for families whose zoned schools are categorized as academically failing. As of yet, that limit has not been reached. The state also expanded the program in 2013 to make families eligible for scholarships based on income—a better, fairer way to determine eligibility. The program has phased in during recent years, and today, lower income students in grades K to 4 are able to access private schools through a state-funded scholarship. Every resident of Cleveland also has access to private school choice through a city-specific voucher program, which is the second-oldest program in the country (next to Milwaukee’s). Finally, Ohio has two programs for students with disabilities—the Jon Peterson Scholarship program and one specific for children with autism.

CER seems to focus only on private school choice. It overlooks Ohio’s robust inter-district open enrollment program, regional STEM and career and technical schools, dual college and high school enrollment programs, and homeschooling options. (Public charter schools and online options are separate categories in CER’s rating system; see the sections below.) In the area of inter-district open enrollment alone, for instance, 488 of Ohio’s 614 school districts participate in the program, and over 70,000 students opt in, enabling them to access better choices, a wider array of courses or extracurriculars, and a host of other benefits.

However, even sticking with CER’s narrow focus on private school choice, Ohio deserves a B. (CER doesn’t indicate where Ohio got dinged in this category.) Expanding income-based scholarship slots (which are currently full), creating an educational savings account program that would enable parents to have greater flexibility in spending and to close opportunity gaps, and incentivizing more high-performing suburban districts to accept open enrollees would boost parent power even further.

JO parent power 1 school choice grade chart

Charter schools

CER hands Ohio a C (and a rank of 24th) for its charter schools. The index rightly criticizes Ohio’s funding disparities for charter schools—as it relates to both facilities and operations dollars—and is correct in worrying about a lack of “diversity and innovation” in the sector. It’s a concern I share.

But blaming this on Ohio’s highly regulated authorizer environment, as CER does, is incomplete, though true in some respects. Ohio’s quality problems over the past two decades are just as much at fault for thwarted innovation. And while I’d agree with CER that charter growth should be allowed beyond Ohio’s Big 8 urban districts and academically challenged areas, the index is glaring in its omission of any mention of quality. Yes, Ohio’s sector has shrunk a bit over the past few years; authorizers are more heavily regulated; and some caps are in place—though only the geographic cap is placing any functional limit on charter options.

But the goal—especially as it relates to empowering parents to have access to good choices—shouldn’t be simply to make the sector bigger and freer. Ohio already tried that. Uneven charter quality, blatant conflicts of interest, and a lack of accountability and transparency led to much of the overregulation currently impacting the sector today. According to CER, Ohio deserves a C grade because of too much regulation, caps on new schools, and funding inequity. It misses the boat in not even mentioning Ohio’s uneven quality.

Ohio could enhance parent power in the realm of charter schools through the following actions: tweaking its authorizer evaluation so as not to penalize authorizers for overseeing high-poverty schools (evaluations that are too stringent on proficiency rates could effectively create a moratorium on new schools); increasing facilities and operations funding for charters; making it easier to replicate excellent models or to recruit great national networks to the state; addressing virtual schools’ quality issues carefully and thoughtfully; and lifting geographic caps such that charters could start up elsewhere, not just within Ohio’s most distressed communities.

JO parent power 1 charter school grade chart

Online learning

Ohio earns its lowest score from CER in the area of online learning—but for reasons you may not expect. With well-documented quality issues and the state’s largest e-school at the forefront of state and national news coverage, it’s perhaps the single most-talked-about charter issue in the state, despite the fact that just two percent of Ohio public school students attend an e-school and the attendance tracking issues are far more nuanced than most would like to believe.

CER says that Ohio’s full-time online options are “limited in scope,” but it’s hard to understand how they could reach that conclusion given that Ohio has ten statewide full-time e-school options, and eight more local options. Ohio lifted the cap for new e-schools in 2013, and since then, three new virtual charters have opened. But if anything, scant enrollment at the newest virtual charters might indicate that Ohio’s virtual school market is over-saturated.

Again, any discussion of parent power should center on quality, not just access. The state has a long road ahead to determine how students can be best served in a virtual environment. The index is right, however, that blended options are limited. So are part-time virtual options such as an online course-access program.

Ohio deserves a D grade in this category. Parent power could be enhanced by overall quality improvements to the virtual school sector; exploring policies that better ensure that students who attend e-schools have sufficient supports to be successful in this type of learning environment; the creation of authentic blended classroom options; and offering access to advanced coursework on a virtual platform—so that e-learning no longer has to be a full-time option and could be done in partnership with existing districts and charters.

JO parent power 1 online learning grade chart

Teacher quality

CER doles out grades that mirror what’s given by the National Council on Teacher Quality in its state teacher policy yearbook—in this instance, a B minus for Ohio.

Teacher quality is no doubt the greatest influencer of student achievement within the four walls of a school, and as such is at the forefront of parents’ minds when making schooling decisions. However, no parent has real power to consistently choose her child’s teacher, so it’s odd to see this category in this index.

The closest we can get to true empowerment on this front would be the dual combination of allowing parents to choose their child’s school and then empowering school leaders to be able to hire the teachers they want (as is the case with charter and private schools).

JO parent power 1 teacher quality grade chart

Transparency

Ohio receives its only A grade in this category, but CER is light on details. With no sources to external ratings or how/why it gives this grade, it merely states, “School report cards are easy to access and present data in a very accessible manner.” This is far too generalized. While Ohio does have easy to understand A through F grades, its lengthy, highly technical report cards have much room for improvement—the topic of a forthcoming Fordham Ohio report. Moreover, ensuring that parents have readily usable information with which to make schooling decisions goes well beyond whether they can download state-level report cards.

I give Ohio a C grade—not only because Ohio’s current report cards are lengthy, wonky, and hard to understand, but because there are so few entities in our state devoted to helping parents understand publicly accessible information. School Choice Ohio helps parents with navigating the state’s voucher programs, and the Cleveland Transformation Alliance assists Cleveland parents. But nowhere in Ohio is there a city-wide common application/enrollment system. Some of the state’s best schools still have open seats, and parents of all stripes continue to struggle to make sense of not only report card data, but their own district enrollment processes, timelines, and options as well.

JO parent power 1 transparency grade chart

Overall, while CER should get credit for attempting to answer a vital question, their rating system needs a refresh. And Ohio itself could do a better job empowering parents. Stay tuned for my next post, a deeper dive on parent power. 

Fordham Logo

© 2026 The Thomas B. Fordham Institute
Privacy Policy
Usage Agreement

National

P.O. Box 110
Burke, VA 22009

202.223.5452

[email protected]

Ohio

P.O. Box 82291
Columbus, OH 43202

614.223.1580

[email protected]

Sponsorship

130 West Second Street, Suite 410
Dayton, Ohio 45402

937.227.3368

[email protected]