
Don’t rush to judgment on test scores
Back in July, the Columbus Dispatch posted an article entitled “Ohio high schoolers test poorly in math.” The story emerged from a State Board of Education meeting at which the Ohio Department of Education (ODE)
Back in July, the Columbus Dispatch posted an article entitled “Ohio high schoolers test poorly in math.” The story emerged from a State Board of Education meeting at which the Ohio Department of Education (ODE)

Back in July, the Columbus Dispatch posted an article entitled “Ohio high schoolers test poorly in math.” The story emerged from a State Board of Education meeting at which the Ohio Department of Education (ODE) shared preliminary assessment results from the 2016-17 school year.
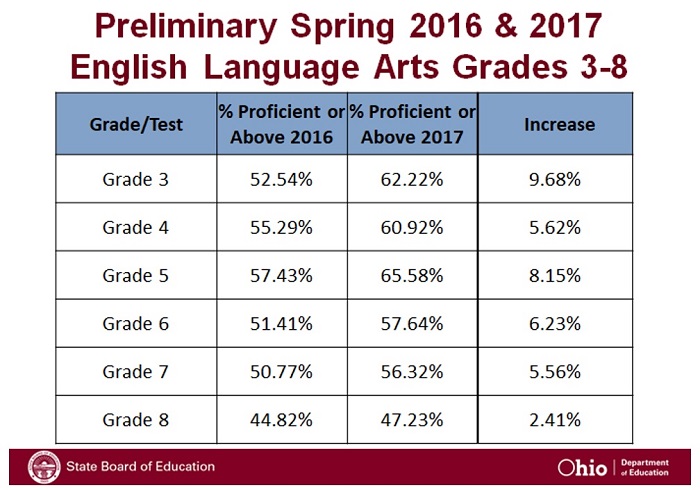
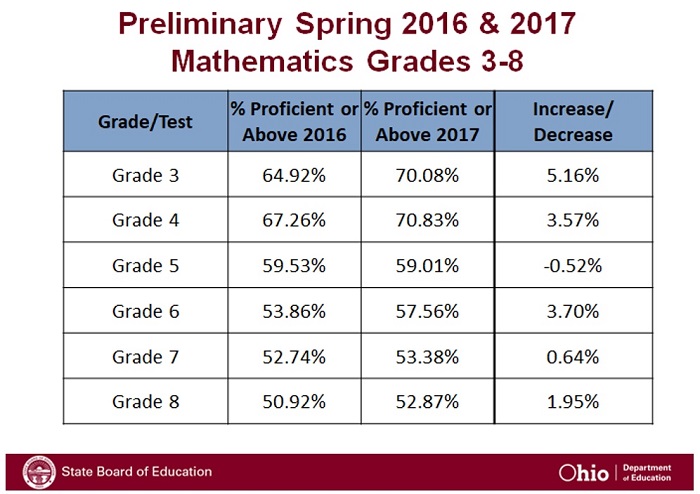
Lost in the headline was the promising news that the results pointed upward for grades 3-8. Of the sixteen state tests administered in those grades, only one—5th grade math—had a lower proficiency rate than in 2016. The tables below show the results for English language arts and math in grades 3-8.
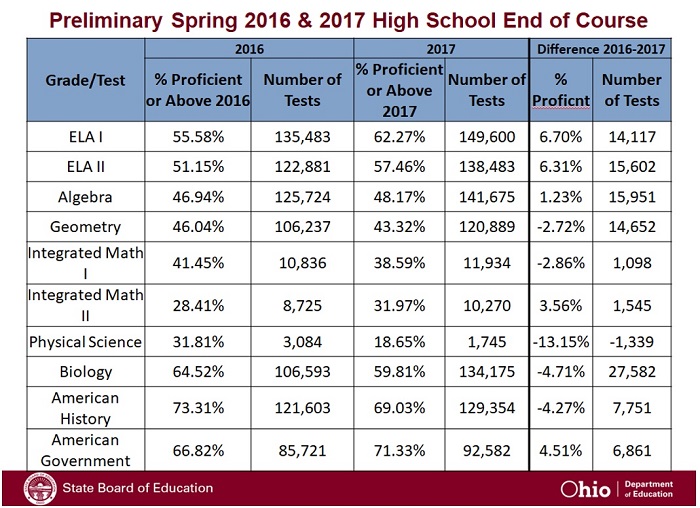
The high school results, however, were more disheartening. The table below shows that five of the ten End Of Course subject exams showed decreases in proficiency: geometry, integrated math I, physical science, biology, and American history.
How concerned should we be? There’s no denying that thousands of students still aren’t doing very well in Ohio’s high schools, particularly in math. There’s plenty of work to be done.
But let’s pause before declaring a crisis. When presenting the EOC data, ODE staff was clear that the 2016-17 preliminary results do not differentiate between students taking tests for the first time and students retaking them. Since EOC results are tied to students’ graduation requirements, those who do not perform well when they first sit for the exam may retake the test. It’s certainly possible—some might say plausible—that students who struggle to pass a test the first time are likely to struggle again on their second attempt.
Could this have impacted proficiency? The department doesn’t yet know how much of the increase in test takers was due to retakes. But enrollment numbers seem to show that the increase in test takers wasn’t just a matter of increased enrollment. And as you can plainly see in the chart above, all but one of the EOC exams had an increase in the number of test takers, and five of the assessments had a ten-percent or more increase in the number of tests administered.[1]
It’s possible that a portion of the drop in proficiency on some assessments was driven by students who were re-taking assessments after having struggled on their first attempt. To determine whether Ohio high schoolers are doing better or worse, we need to be able to look at results for first-time test takers compared to other first-time test takers. That disaggregation is expected in the coming weeks, along with school and district report cards.
We’d also be wise to remember that the EOC exams are part of a concentrated effort to raise expectations for Ohio students. Here at Fordham, we’ve long warned that truly raising the bar would lead to lower test scores before it led to higher ones. The previous state assessments, known as the Ohio Graduation Tests (OGTs), were shockingly easy for most high schoolers because they assessed eighth grade-level content. The EOCs are more rigorous by design. Policymakers and school officials recognized that parents and taxpayers were being misled by state test results that didn't reveal actual proficiency, and they committed to raising expectations.
But almost immediately after doing so, consequences got real, and folks started to vacillate. Ohio made national news when officials opted to lower cut scores instead of holding the line as other states were doing. Most recently, the state legislature opted to create alternative graduation pathways for the class of 2018 in response to widespread fears that too many students would fail to pass the same EOCs discussed here. Ohio has a history of sidestepping accountability—and panicking too soon about poor test scores is a bit like offering a pyromaniac a match.
Until the department disaggregates first-time test takers and re-takers, there’s no way to know whether scores are rising or falling. Before the legislature decides to lower expectations for additional graduating classes based on poor test scores, they would be wise to remember why we raised the bar in the first place: Far too many Ohio students are stumbling when they encounter the higher bars of college and the real world. They deserve better.
[1] The only test that didn’t have a higher number of takers but still saw a decrease in proficiency was physical science, which is in the process of being phased out and replaced by biology.
July and August might otherwise be sleepy months best reserved for recovering from Ohio’s biennial budget process, lounging beachside, and avoiding one’s smartphone and computer. The downtime also creates space to reflect. In the world of education policy, there is much to ruminate about, especially when it comes to the words and actions of our state leaders and the impact their decisions will have on Ohio students.
One such group of decisions makers is the State Board of Education, a nineteen-member board of partially elected, partially appointed leaders whose stated vision is: “For all Ohio students to graduate from the PK-12 education system with the knowledge, skills and behaviors necessary to successfully continue their education and/or be workforce ready and successfully participate in the global economy as productive citizens.”
Unfortunately, board members’ vacillations in recent months on foundational elements like testing, accountability, standards—even the basic belief that schools can make a real difference in helping students—seem to undermine that vision. The board most visibly took up the mantel of mediocrity this spring during the state’s debate over what should constitute appropriate graduation requirements. In April, members adopted recommendations (later adopted by the legislature and passed into law) that set Ohio on a pathway to essentially require nothing of its 2018 high school graduates. It’s a quintessential example of state leaders peddling low expectations for students if ever there was one.
Other recent actions and remarks from board members seem to reinforce their tendency to waver. It’s important to note that the board’s official power is fairly limited—focused primarily on oversight of the state education department, teacher licensure, and decision-making on technical matters. Yet the nineteen members do play a leadership role within Ohio’s K-12 system. They regularly engage with the media, visit classrooms, speak with superintendents, and act as the de facto public face of education leadership in our state.
So what have they been saying lately on the state’s education matters? Have a look at July’s board meeting.
Third-grade reading guarantee
In a 12-5 vote, the board moved to increase the proficiency cut score for the third-grade reading assessment that students must pass in order to move on to fourth grade. This increase was explicitly required by the Ohio Revised Code (through past legislation that put in place the state’s third-grade reading guarantee), so the board’s vote should have been perfunctory.
Meryl Johnson voted against the heightened standard, explaining herself this way (as reported by Gongwer News):
“I also understand the importance of children being able to read, having been a teacher for so many years, but I just feel we have not taken the time or done the research to really find the best way to make that happen.”
I’m not sure what’s more alarming: that a veteran teacher admits to not knowing the best way to get a child to read or that a current state board member would suggest that Ohio should spend additional time conducting research when most everyone recognizes the importance of helping children read before exiting the primary grades. That’s not to say further reflection and research are a bad idea—but the lack of urgency here is striking.
Also weighing in on this issue were board members Stephanie Dodd and Martha Manchester, troubled that the threshold rose not only for kids taking the regular third grade reading test but also for those who take alternative assessments.
As the Plain Dealer reports, Dodd said:
“We have school starting in five weeks and we have children that could be retained when they shouldn’t be. That’s not right.”
Manchester said:
“This is a really big deal. I’ve known nothing about this, and all of a sudden I hear that there’s all these children that could be affected and it tears at my heart.”
To be clear, these remarks refer to students who failed the state reading exam and also failed the alternative exam. It’s hard to see why such pupils should be promoted, given that state law requires they be retained. The State Board of Education’s role as an executive agency is to enforce the law, not find ways around it. I understand the empathy shown by Manchester, but the fact that there are nine-year-olds who can’t read is just as gut wrenching. Moreover, what’s really “not right” is that local education leaders are asking the state to give them another reprieve rather than doubling down and doing what it takes to get more students reading on grade level.
“We can’t fix schools before we fix poverty”
The board also discussed the academic distress commission model that now affects Youngstown and Lorain schools. School districts that are chronically low performing will see a series of consequences that include lessening the power of their elected board (abolishing it after four years of no improvements). Gongwer noted that members “continued to use the words ‘dismantle,’ ‘privatization,’ and ‘takeover’ to describe the policy change.”
Meryl Johnson’s remarks would seem to reflect more concern about the rights of the adults in charge of the state’s worst-performing schools than about the children trapped in those schools:
“If we’re going to talk about stepping in to other districts and taking away the power of their elected school boards… I would like to see the kind of resources and assistance that we’re offering to those districts here on out so that we really give them the help they need instead of stepping in and taking their districts away from them.”
This seems to ignore the tremendous resources that Ohio taxpayers have already invested in their lowest-performing school districts with virtually nothing to show for it.
Linda Haycock obfuscated the issue at hand with her remarks, though she at least mentioned children:
“I wanted to express some of my skepticism for any system, any governance anything that is put in place to educate children if the socio-economic culture of the community isn’t addressed. It’s not going to surprise me at all if we get down the road and wait and see… the schools, the educational indicators still aren’t happening because the real issue is the financial security, the mobility of the children.”
Such comments aren’t atypical from our state’s leaders, unfortunately. But they are largely unhelpful. If Ms. Haycock plans to wait until poverty is eliminated before tangible improvements can be made to schools, she has a frustrating road ahead. And if she doesn’t believe that schools can make a real difference for poor kids, then why is she serving on the state board of education?
Ohio’s ESSA Plan
The board’s July meeting brought approval of Ohio’s draft ESSA plan (which now awaits the governor’s sign-off). That plan reduces from 30 to 15 the minimum number of students in a given subgroup (e.g., students with disabilities, students of different races, etc.) required for reporting and accountability purposes. Linda Haycock put forth an amendment to ax that change, citing a common but unsubstantiated refrain about student privacy:
“When you have such a small subgroup in a school district, it’s easy to identify the people who are included in that subgroup.”
Kudos to the members who defeated the amendment and who spoke in support of reducing Ohio’s subgroup size. Meryl Johnson noted that she would:
“hate to see groups being left out… It’s very easy to ignore students some times.”
This is essentially the premise of standards and accountability-based reforms in a nutshell—the public deserves to know how well schools are serving all students. ESSA’s requirements around annual testing and reporting information on student sub-groups is a key part of ensuring that schools are on the hook for it.
Meanwhile, Laura Kohler shared real-life experience from her term as a local school board member, noting that her district “learned valuable information about whether it was closing achievement gaps for students in subgroups.”
Live streaming
Finally, Nick Owens deserves credit for proposing that state board meetings be live-streamed, not only to inform “everyday Ohioans” but also so new members could get up to speed on past meetings. On that issue, Board President Tess Elshoff had this to say to Gongwer News:
"I've tried to work really hard this year on encouraging everyone to speak up and state concerns or issues and things of that form and I guess I'm a little hesitant because sometimes when cameras are on, people get shy and I don't want someone to not object to something that they disagree with because cameras are rolling… I guess my biggest concern is just that it may possibly change the direction of dialogue from board members, be it good or bad.”
Here’s hoping that our state board members can get over feeling hesitant, shy, or equivocal and act boldly on behalf of the 1.7 million kids they were elected and appointed to serve.
Confronted with the paradox of a simultaneous rise in high school graduation and college remediation rates, researchers from The Alliance for Excellent Education examined diploma pathways across the country for evidence as to how well they match college or career expectations. They found that far too many students leave high school with diplomas that do not signal preparedness for what comes next.
The Alliance’s new report looked at all fifty states and the District of Columbia and found that there were 98 different pathways to diplomas for the Class of 2014. Slightly less than half were deemed sufficient to prepare students for college or careers (CCR diploma pathways). While college and career ready can be defined in a number of ways, the Alliance’s criteria for a CCR diploma are: 1) Any pathway that requires students to complete four years of grade-level ELA, three years of math through Algebra II or Integrated Math III; and 2) Any pathways promulgated by state institutions of higher education that fully align with admissions requirements into those institutions. All of their analyses follow from these requisites.
The most frequent reason for a rating of “non-CCR” for a diploma pathway was a mismatch between state-level high school graduation requirements and state-adopted content standards in ELA and mathematics. For instance, the General Diploma in Indiana—singled out as a case study in the report—required only 2 years of math and therefore was considered non-CCR by the Alliance. Two of the other pathways in Indiana required three years of math; the most rigorous pathway, four. Not that some Hoosier students earning the General Diploma didn’t make it to and through college, but the data showed that only 24 percent of General Diploma awardees in 2014 enrolled in college and that three out of every five students who did required remediation. Students who earned one of Indiana’s other three types of diplomas (all considered CCR pathways by the Alliance) were far more likely to enroll in college and far less likely to require remediation when they get there. In addition, the data showed that many states granted waivers of either course or assessment requirements for even their CCR diploma pathways for reasons unrelated to special needs. The number of students being granted waivers is unknown, but any undermining of CCR diploma requirements seems superfluous as well as misleading, considering the plethora of non-CCR diplomas already available.
Alliance analysts also took a deeper look at states that had multiple diplomas that included both CCR and non-CCR pathways with an eye to determining how many students earned each type. Nine states fit into that category: Arkansas, California, Indiana, Maryland, Massachusetts, Nevada, New York, Texas, and Virginia. From them we learn that 1) The rate at which students graduated with a CCR diploma in these nine states was substantially lower than the adjusted cohort graduation rate (ACGR). For example, Nevada’s ACGR for all students was 70 percent in 2014 while its CCR rate was just 29.8 percent. 2) Traditionally underserved students were less likely to graduate with a CCR diploma than their peers, the one small exception being Black students in Arkansas. 3) The three states whose CCR diploma was the main graduation pathway and where the non-CCR diploma was “deemphasized” or seen as a less-desirable alternative (Arkansas, Indiana, and Texas) saw far lower gaps between ACGR and CCR rates. 4) The other six states did not emphasize CCR non-CCR pathways and their ACGR/CCR gaps were considerably larger.
Black students fared worst among racial/ethnic subgroups with ACGR/CCR gaps ranging from 17.5 to 33.9 percentage points. ACGR/CCR gaps between students with disabilities and their peers without disabilities were also pronounced, with gaps ranging from 11.8 to 63.1 percentage points. These statistics are all fairly alarming, but many important questions remain out of reach. Did students opt for easier pathways themselves? Were they somehow “tracked” into them? What influence do teachers and guidance counselors exert on diploma pathway choices and when? How readily can students overachieve beyond minimum requirements?
The nation’s rising graduation rate in recent years has already been challenged as consisting in part of smoke and mirrors. The rate of new college freshman requiring remediation gives us a clearer picture of what really happens when the smoke clears and students are no longer the responsibility of the K-12 folks behind the mirrors. This study brings us fresh evidence that “graduation at all costs” is widespread. States must be exhorted to set the bar for graduation no lower than college and career readiness and must make that the default diploma pathway for their students, with rare exceptions for disability and such. Non-CCR pathways and waivers should be offered only in special cases. Perhaps it is a pie-in-the-sky wish for every diploma to indicate readiness for what’s next, but to make anything less than that that the primary emphasis of a graduation pathway is a disservice to students from the outset.
SOURCE: “Paper Thin? Why All High School Diplomas are Not Created Equal,” Alliance for Excellent Education (July, 2017).
Research continues to point to the correlation between socioeconomic status and educational outcomes. Three new initiatives in the Buckeye State are cause for cautious optimism that old methods of addressing poverty may be giving way to innovation and new promise, especially for our youngest citizens.
While none of these efforts specifically include education components, we at Fordham Ohio support creative efforts to lift poor families in the state. Schools generally have sufficient resources to do the work of education, but additional help is certainly welcome when it comes to fighting the effects of poverty. J.D. Vance and Mauricio Lim Miller are living examples of how a state of poverty does not determine the upper limit of a student’s achievement. The folks behind MOVE to Prosper similarly count high-quality schools as a vital resource often out of reach of poor families. If families must move to access better education and a better future, then let’s get moving.
We will be keeping an eye on all of these exciting new efforts through our Ohio Gadfly Daily blog, our biweekly email newsletter, and our thrice-weekly summary of Ohio education news clips. You can subscribe to any of our publications via this sign-up link.[1]
[1] Please make sure to only sign up for the items you really want to receive. The Thomas B. Fordham Institute is a prodigious commentator on education issues both in Ohio and nationally, and checking all the boxes will likely result in a large volume of emails.
NOTES: John Mullaney is the Executive Director of the Nord Family Foundation. Both authors were part of the Straight A Fund advisory board in FY 14-15.
This piece originally appeared in a slightly different form in the Cleveland Plain Dealer.
In 2013, Governor Kasich and Ohio legislators enacted the Straight A Fund, one of the nation’s largest statewide competitive grant programs for K-12 education. The idea sprang from philanthropic foundations across Ohio who saw this as an opportunity to have the state co-invest in truly innovative approaches to teaching, learning, and assessment. A 2009 report Beyond Tinkering was presented to the legislature with specific recommendations to initiate such a fund. With $250 million in state funding over fiscal years (FY) 2014 and 2015, Straight A awarded sixty-one grants in amounts ranging from about $200,000 to $15 million. The fund was intended to spark innovative thinking and practices with the goal of boosting student achievement and reducing costs.
Yet after an initial burst of excitement, enthusiasm for Straight A waned. Collaborators from the philanthropic sector expressed concerns about the legislative emphasis on cost-savings, which some felt eclipsed the focus on innovation and achievement. In FY 2016-17, state lawmakers slashed funding to $30 million over the biennium; this June, the legislature pulled the plug and cut off program funding entirely. Anecdotes suggest that some of the grants may have been successful, but unfortunately—as we discuss in more detail below—we know of no hard evidence on whether the program has led to improved student learning.
We both think it’s critical to incentivize promising education practices, and we’re rooting for Straight A to succeed. This can mean new approaches not only to instruction, but also assessment and even organizational management in schools. As members of the Straight A grant advisory panel, we had a unique opportunity to see, up close and personal, certain aspects of implementation. Based on our observations, we believe policymakers can draw important lessons about the design of an innovation fund. We offer our thoughts not as Monday morning quarterbacks; rather, if Ohio decides to reboot an innovation fund—a worthy goal indeed—we believe giving careful thought to the following issues is essential.
Funding amounts
Many of the Straight A grants were multi-million-dollar projects. Grants of $13 to $15 million far exceeded, by many millions, grants made to districts and schools by Ohio’s private foundations. While some of the grants were awarded to multi-district consortia, the sizeable amounts seemed to present challenges. For one, the massive size of the overall program and the grant amounts likely created unrealistic expectations for immediate, home-run results. In addition, as lottery-winning horror stories remind us, managing an unexpected windfall is a surprisingly difficult task. Indeed, in an early round of grants, we heard that some grantees might have issues spending down the funds on a relatively short schedule. It’s not clear whether districts ultimately felt rushed, but the large amounts plus time constraints may have led to less than optimal spending decisions.
While the funding amounts surely made a splash, a modest fund may have been more workable for grantees while also delivering the innovative spark lawmakers were aiming for. While not in the realm of education, rigorous research on federal R&D grants for energy projects finds that pilot grants of about $150,000 packs as big a punch as its larger and more burdensome program that awards $1 million grants. In a future iteration, Ohio lawmakers could consider scaling back grant amounts to more reasonable amounts. Such a program could offer educators a chance to test-drive new ideas without much fuss. For larger, more complex projects that require major investments, such as launching new schools or scaling successful pilot programs across multiple districts, lawmakers could create a separate grant, perhaps with different timelines and application procedures. A “tiered” structure for grants with different purposes, processes, and awards would be more akin to the U.S. Department of Education’s i3 Fund.
Grant application
Having read dozens of grant applications, we can say that the application itself was cumbersome. Applicants had to answer a bevy of questions that asked among other things: how the project would affect student learning; how it would be sustainable; how the project would affect instruction; and how it would reduce costs. Predictably, many of the applicants, putting their best foot forward, offered long-winded, jargon filled responses. The long, clunky application may have deterred some schools from applying—perhaps those lacking professional grant-writing help. It also seemed to favor complex, collaborative (and highly ambitious!) projects over more modest school- or classroom-level initiatives.
A slim, straightforward application should encourage a wider pool of applicants. State lawmakers can assist in this regard: In the appropriating legislation, they can place bare minimum parameters around the program. For example, one of the legislative goals of Straight A was to achieve “cost savings”; in turn, applicants had to answer fiscal questions, which meant engaging treasurers to fill out complicated financial forms. An open-ended law and a hassle-free application should be more inviting to classroom teachers and principals wanting to try something different.
Application review
As grant advisors, we received briefings on the Ohio Department of Education’s (ODE) “blind” application review process. The emphasis on the blind review was a political move to avoid skepticism among several administrators we spoke with that the sheer amount of the grants would open itself to favoritism and a rigged system. To avoid the appearance of favoritism, the process developed an overemphasis on statistical analyses and rankings to ensure fairness—but it also lacked a key element of a successful grant program: interaction between the grantor and potential grantee. A communication from private philanthropy to the ODE suggested they change the model to include site visits with potential grant recipients, stating clearly that in private philanthropy, no board would ever approve a grant request without a personal site visit with grantees. As professionals in both the philanthropic and venture capital sectors would tell you, one learns as much about the true capabilities of an organization by meeting with the principals involved as from an examination of the business plan.
That advice went unheeded and instead the second round continued with a purely mechanical review, with statisticians crunching numbers, and decisions made in a locked room in Columbus. Moving forward, policymakers should insist on incorporating an interview with prospective grantees as part of the process. State officials and/or members of a grant advisory board could interview those who make it through a screening stage. This would offer an opportunity to ask clarifying questions about the application, provide a better picture of the context in which the project will take place, and start building a trusting relationship between the grantor and potential grantee. After an interview, a final decision could be made.
Rigorous evaluation
Although the legislation was lavish in its funding, there was no appropriation for evaluation. Shortly after implementation, we raised concerns about the apparent lack of a robust evaluation of Straight A. ODE has invested $200,000 in research on the program, which included a survey and a broad analysis of report card data. But we know of no rigorous empirical analysis of Straight A—either as a whole or at individual grantee sites. Any evaluation of Straight A has been kept in-house and certainly has not been well publicized. Without solid, widely disseminated evidence, it’s just not clear whether the program has met any of its goals to make a difference for students or provide cost efficiencies in doing so.
How can Buckeye policymakers better ensure proper evaluation? The state could prioritize randomized, experimental projects, perhaps giving them “extra credit” in the application review. These types of projects would be more conducive to what Harvard’s Tom Kane calls “short cycle clinical trials,” which offer a quick turnaround and quality evidence on the effectiveness of innovations. If randomization isn’t possible or if such an evaluation would prove too expensive relative to the size of the project, then the grantee could be encouraged to conduct a quasi-experimental study, such as on the one conducted on a modest-sized tutoring program from Youngstown. Any foundation making investments of this size would bring in outside expertise to evaluate these programs, and Ohio has many organizations of high repute more than capable of conducting research.
As for transparency, ODE could create a central library of studies—a What Works Clearinghouse of sorts—from individual grantees. This would allow easy access to educators and the public on which innovations worked and which did not. Rigorous evaluation and this level of transparency would also help the public and policymakers gain a sense of the overall impact of the innovation fund, as well as provide evidence on which innovations hold promise for replication.
***
Ohio legislators were on the right track with the adoption of an innovation fund. Yet Straight A had design problems that limited its ability to meet—or prove that it met—program goals. If Ohio policymakers carefully consider the issues above, we believe that the next iteration of Straight A will better spur innovative practices that benefit both students and the professional educators that work with them for years to come.
Charter opponents have long claimed that charter schools siphon resources away from the traditional public school system. The ideological motivation for this line of reasoning is clear when touted by teachers unions and their friends: i.e., calling charters parasitic unless they conform to traditional school practices, including mandatory unionization, makes that bias obvious. There’s also a technical basis for the argument, given how charters are funded in Ohio and in many states. Indirect or pass-through funding inevitably feels like a loss to districts and contributes to hostility toward charter schools for “stealing” students and “draining” the system.
But what impact do charter schools actually have on traditional public schools and the students who remain there? Are such loaded accusations deserved? Or might the presence of charters improve student outcomes through competition or as effective charter practices spill over into district schools?
Recent research from Temple University professor Sarah Cordes sheds needed light on this question. Cordes examined the impact of charter schools in close proximity to, or even co-located with, traditional public schools (TPS) in New York City over a fourteen-year time span. Her analysis departed from previous research examining charter effects at the district level or across a much-wider radius (up to 10 miles, versus Cordes’ one-mile radius), and was also the first peer-reviewed study of the academic impacts of co-location. Data came from 900,000 students in grades three through five. The study design (a difference-in-differences model) was similar to past research on charter effects, but Cordes added new statistical checks to avoid conflating possible student composition changes at the schools with performance gains. The study also examined school-level factors not previously well-studied that could explain charter effects on TPS performance.
So what did she find? Exposure to charter schools significantly increased student performance at nearby traditional public schools. The effects increased with proximity to the closest charter school; students at traditional publics schools co-located with charters experienced the greatest positive impacts. Small impacts were observed for schools close to charters but began dissipating when a half mile or more away. Students at traditional public schools also experienced reductions in grade retention when co-located with or close to a charter, as well as small positive effects on their attendance. As for the impact on student subgroups, the most positive impacts of charter exposure (for students in nearby traditional public schools) occurred for poor students and those eligible for special education services. There was no significant impact for public schools that co-located with another public school: In other words, it was the shared space with a charter that made the difference.
The study also examined possible school-level reasons for positive charter effects, using parent and teacher survey data. Several plausible explanations emerged. Traditional public schools co-located or nearest to charters experienced improved student and parent engagement, higher expectations for students, and improved perceptions of safety and school cleanliness—any or all of which could have translated to improved student performance. It’s also possible that those public schools’ increased per-pupil expenditures (PPE) of two to nine percent—resulting from student attrition (more dollars spread over fewer students)—helped have a positive impact.
More work remains on digging into the reasons why traditional public school students might experience positive effects from nearby charters so that others might emulate such improvements. Most importantly, the study confirms that charter schools can have a positive competitive effect on nearby public schools. This confirms previous research showing that not only charters, but other forms of choice like vouchers, can impact traditional public schools for the good. More districts—especially those with excess capacity in their school facilities—should consider co-location with charters for the mutual benefit of all students and families.
Sarah A. Cordes, “In Pursuit of the Common Good: The Spillover Effects of Charter Schools on Public School Students in New York City,” Education Finance and Policy (July 2017).