Yesterday, the U.S. Department of Education released the math and reading results of the National Assessment of Educational Progress (NAEP). The assessments were administered to a nationally representative sample of 376,000 4th graders and 341,000 8th graders from all 50 states. For a national perspective on the NAEP data, click here.
Here in Ohio, math and reading results for public school students in both grades were flat compared to 2011. Meanwhile, less than 50 percent of Ohio’s fourth and eighth graders meet NAEP’s proficiency standard. The proficiency rates for Buckeye State students are as follows: 48 percent in 4th grade math; 37 percent in 4th grade reading; 41 percent in 8th grade math; 39 percent in 8th grade reading. These underwhelming statistics aside, the state continues to post scores that surpass the national average.
One can also slice the 2013 NAEP data in many ways—by racial group, by poverty status, by special education status, and more. One can even compare charter to non-charter school students, which I do in this post.
The figures below display the charter versus non-charter comparison of students who are eligible for the Free and Reduced Price Lunch (FRPL) program, the most-utilized poverty metric available. This provides a fair comparison of similar students, since Ohio’s charters enroll a relatively high number of impoverished students.
The charts show the average scaled score estimates (scale is 0 to 500) for the two groups, along with the standard errors displayed as vertical lines. The standard error, in parentheses, is the measure of uncertainty around the score estimates—recall, NAEP is a sample—and note the higher standard errors for charters, likely due to its smaller sample size.
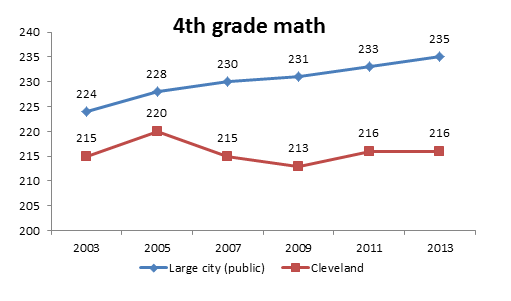
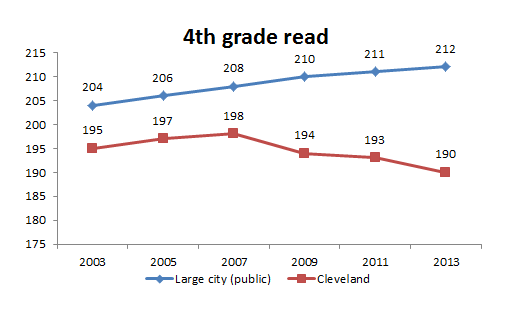
The results from this snapshot in time are not favorable to charter schools. In all four grade-subject combinations, charter school NAEP scores fall short of the non-charter school scores. And in all cases, I would consider the margin fairly wide—more so in 4th than 8th grade. In 4th grade reading, for example, non-charter students’ average score was 211, while charter students’ average score was 191, a 20 point difference.
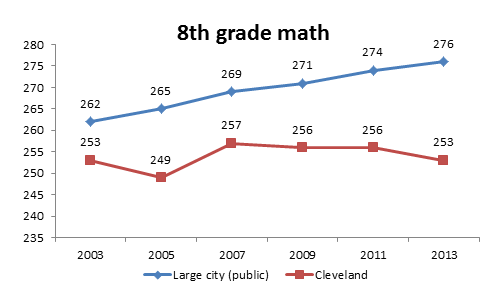
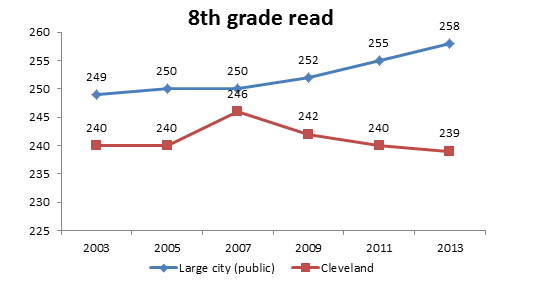
The difference, however, narrows in 8th grade. Charter school scores are only 5 points lower in reading and 6 in math. The standard error bars nearly overlap in 8th grade, but not quite—if the standard error bars had overlapped, the difference in scores would not have been meaningful.
State data and now data from the nation’s best barometer of achievement depict the weak performance of Ohio’s charter schools in the aggregate. Certainly, there are great charter schools in Ohio, and these schools are here to stay. Nevertheless, this state’s charter school program, as a whole, needs a major repair—starting with getting tough on charter school authorizing.
Charters fall well short in 4th grade - Ohio charter versus non-charter, Free and Reduced Price Lunch students, 2013 NAEP
Charters fall short (but less so) in 8th grade - Ohio charter versus non-charter, Free and Reduced Price Lunch students, 2013 NAEP