
Late last night, results were released from the National Assessment of Educational Progress (NAEP)—an exam that is widely considered the best domestic gauge of student achievement. NAEP is administered in each state, every two years, to a representative sample of fourth and eighth grade students in reading and math. With its rigorous content and stringent standards for meeting proficiency, NAEP provides a clear and honest view of student achievement in Ohio and across the nation.
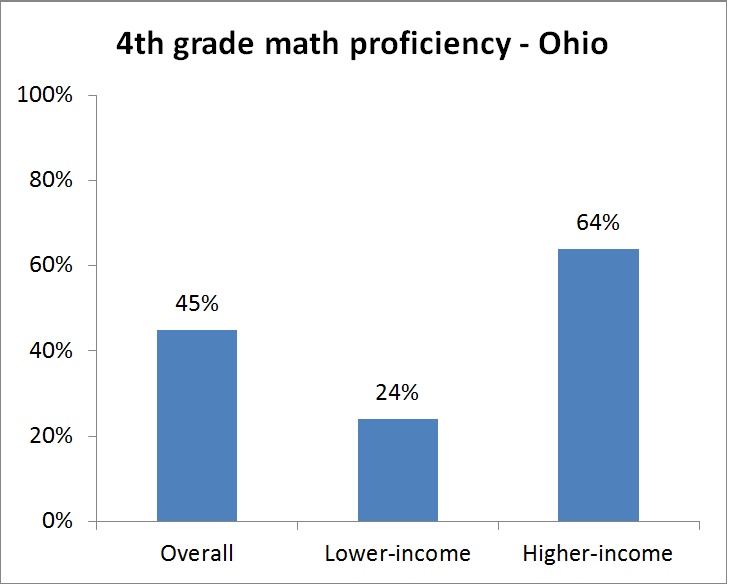
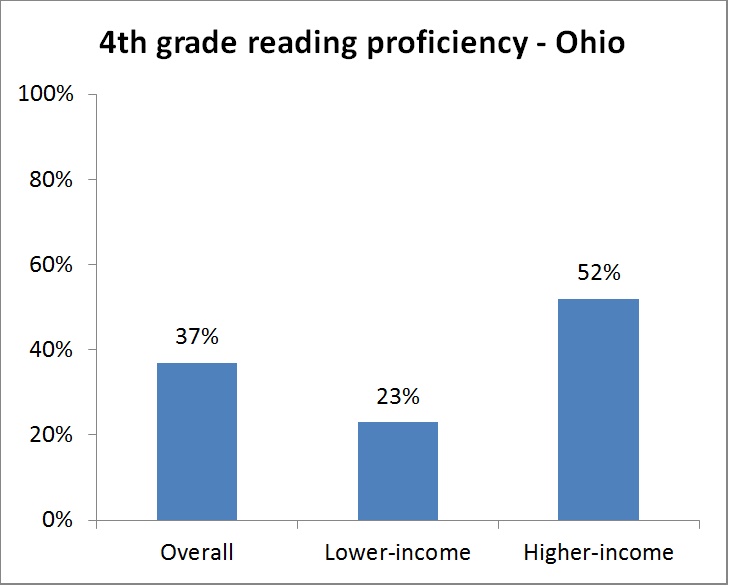
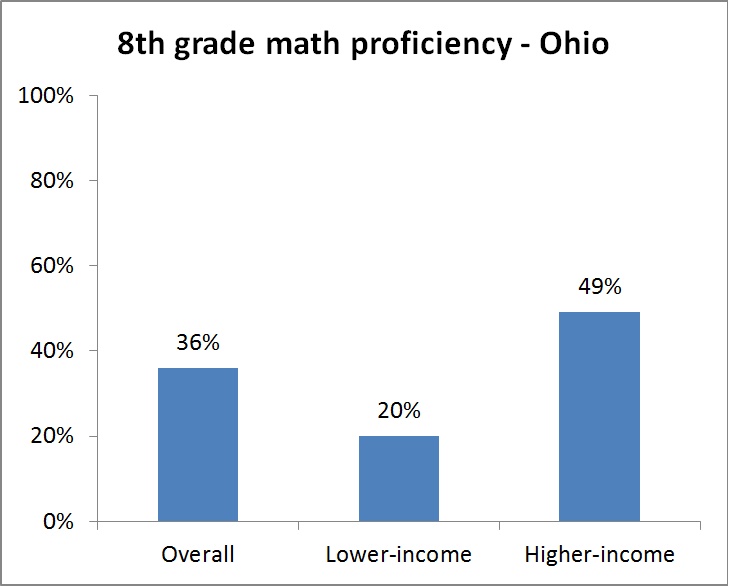
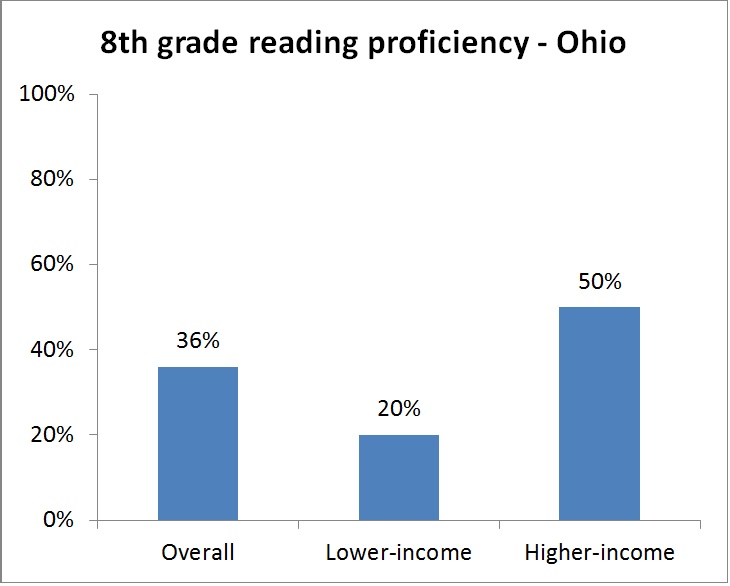
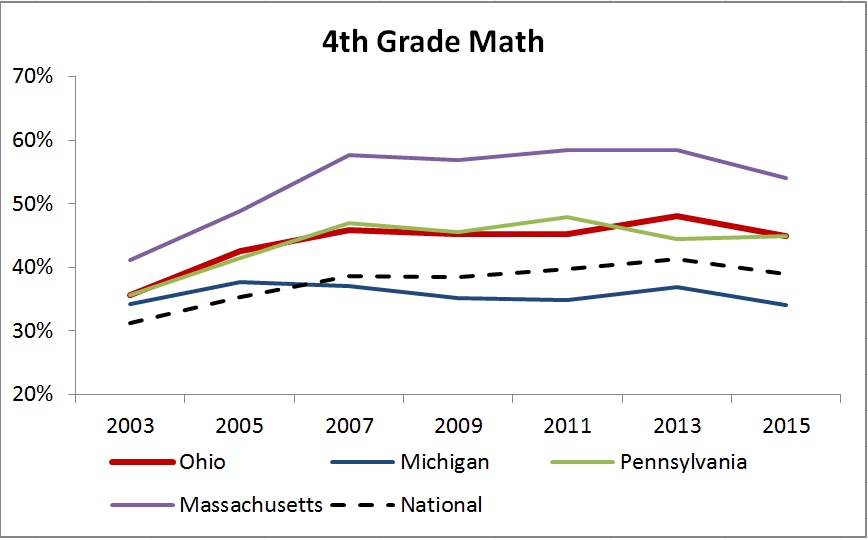
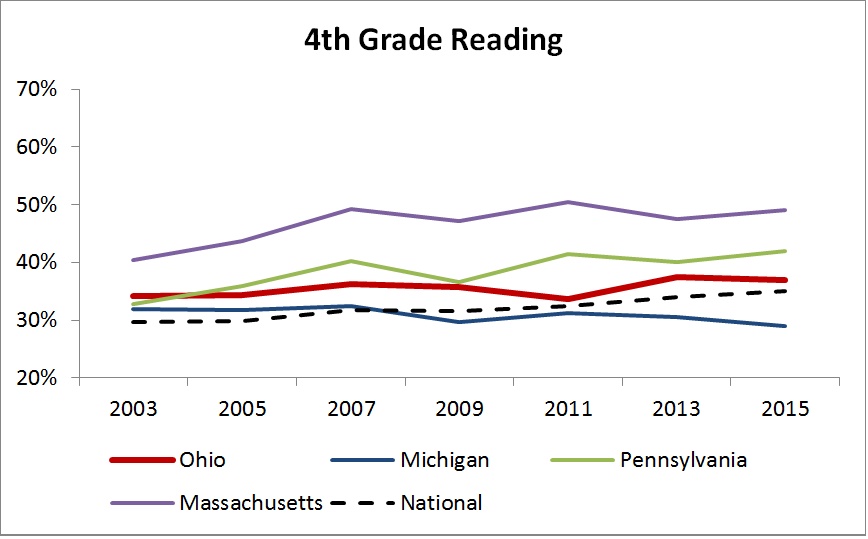
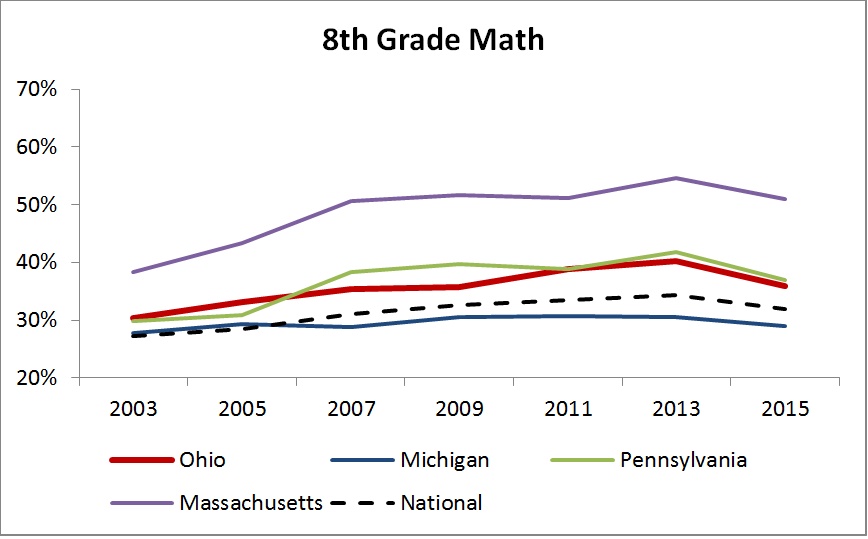
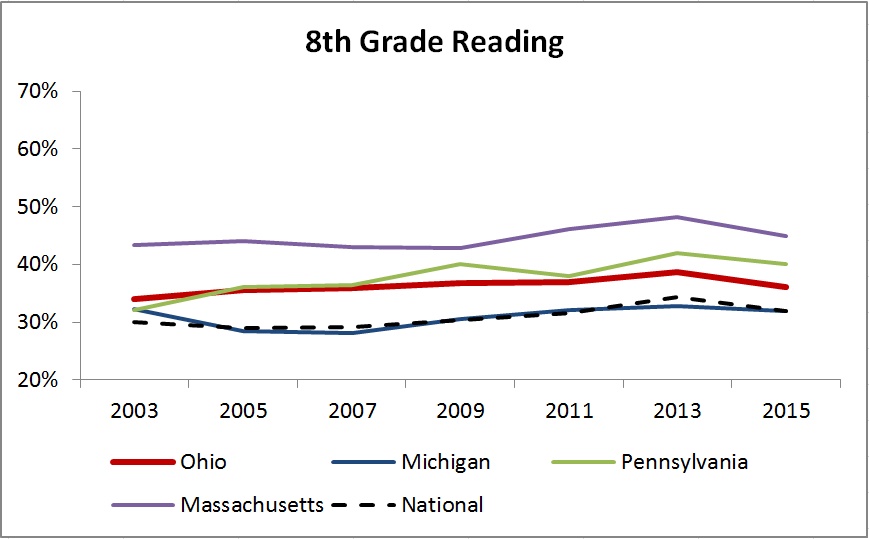
The bottom line from these test results is that too many Buckeye children are struggling to meet rigorous academic goals. The NAEP results for 2015 show just 45 and 37 percent of fourth graders are proficient in math and reading, respectively. In eighth grade, only 36 percent of youngsters are proficient on each of the assessments. Relative to national averages, Ohio students achieve at somewhat higher levels—though some of that is due to its favorable demographics vis-à-vis poorer states. Yet their performance still trails well behind the top-performing states in the nation, such as Massachusetts and New Jersey. Compared to 2013—the last round of NAEP testing in these grades and subjects—student proficiency in Ohio was slightly lower (as were the national averages).
The following sets of charts display in more detail some of the key takeaways from the 2015 release of NAEP. One set provides a point-in-time “snapshot” of achievement within the Buckeye State, while the other takes a look at the longer-term trends in achievement for the nation, Ohio, and a few other states.
Ohio student proficiency, overall and by income status, 2015
The first set of charts displays NAEP proficiency rates for Ohio students, by grade and subject, and also split by their income status. (Lower-income refers to students eligible for free or reduced priced lunch—below 185 percent of federal poverty level or roughly equivalent to $45,000 for a family of four.) As you can see, between 36 and 45 percent of students overall are proficient on NAEP depending on the grade and subject. But students from lower-income families achieve at considerably lower levels than their higher income peers. For instance, in fourth grade math, only 24 percent of lower-income students reached proficiency while 64 percent of their more-affluent peers did so—a gap of 40 percentage points.
Ohio student proficiency, relative to other states and national average, 2003 to 2015
The next set of charts places Ohio student achievement within a national and regional context, and compares results with Massachusetts, a state that since the mid-2000s has consistently topped the nation in NAEP achievement. As you’ll notice, Ohio’s achievement has and continues to exceed the national average; it matches closely with Pennsylvania and is considerably above Michigan. However, Ohio achievement falls significantly short of the national leader, Massachusetts. (Other high-performing states include New Jersey, Minnesota, and New Hampshire.) These charts also display the general downturn in student achievement from 2013 to 2015 that occurred in Ohio and across the nation—except in fourth-grade reading, which showed a slight uptick.
* * * *
So what do these data mean? First, it’s fair to say that too many students in Ohio are struggling to meet rigorous academic goals. The results from NAEP indicate that well under half of Ohio students are reaching an honest definition of proficiency—and sadly less than only one quarter of students from low-income households do so. There is no question that achievement is not where it needs to be in the Buckeye State.
Second, it is disappointing that Ohio couldn’t buck the national downward trend in NAEP proficiency from 2013 to 2015. Ohio has the capacity—and opportunity—to become a national pace-setter in education. Yet the results suggest that the Buckeye State’s performance over time is really no better than the rest of the country.
Third, it’s not clear at this point how these data correlate to the policy reforms currently being implemented in Ohio and elsewhere (e.g., higher academic standards, new assessments, and more). Some may argue that the sluggish results for 2015 are a reason to backtrack on reform. Others may suggest the need to “double down” on policy reform. But in this regard, perhaps state policymakers can learn from Cleveland, which, in the face of statewide and national declines, demonstrated promising gains on its 2015 NAEP-TUDA results. Cleveland’s educational leaders have made a clear commitment to change, and by all appearances, school-level leaders, citizens, and parents are buying in—to the benefit of the city’s students.
Perhaps state leaders should do the same: While the policy framework for success is beginning to solidify, the empowerment of school leaders and parents seems to be lagging behind. Whether the Buckeye State can top the nation in student achievement might just depend on whether its state policymakers are up to their leadership task.
