Ohio’s teacher preparation programs, especially those run by public universities, select mediocre students. So say the data from the Ohio Board of Regents recent release of data on the performance of Ohio’s teacher preparation programs. This is the first publication of data on teacher preparation programs (or “ed schools”) that is required under House Bill 1 (2009).
Among the data released are admissions data, value-added scores of teachers who graduated, and teacher licensure exam scores. These data vastly improve the information we have about the quality of teacher preparation programs—and the students who attend them.
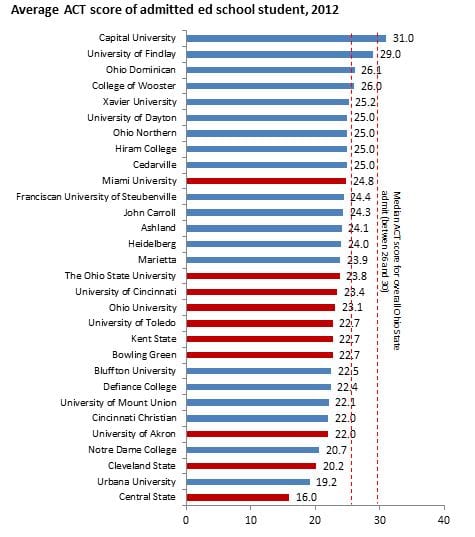
One indicator of the quality of the preparation program is the average ACT scores of admitted students. A higher average ACT score indicates greater selectivity and, most likely, higher program quality.[1] The chart below ranks the average ACT scores of students who were admitted in fall 2012. I exclude three universities because they have less than ten students in their teacher preparation program. In addition, 16 universities didn’t report an average ACT score and one ACT score appears to be an error. These teacher preparation programs vary in size, enrolling anywhere between 13 and 1,687 students.

Source: Ohio Board of Regents. Note: Public institutions are colored in red; private institutions are colored in blue. The range of ACT scores is 1 (low) and 36 (high). The statewide average ACT composite score for students admitted into a teacher preparation program is 22.75. The overall ACT average for Ohio students was 21.80 in 2012. The median ACT score of an admitted Ohio State University student is between 26 and 30. The median ACT score of an admitted Case Western Reserve University student is between 29 and 33.
A couple things stand out from this chart. First, private universities have higher quality admits. Capital University, a private university in Columbus, tops the list—a full two points higher than the University of Findlay, another private university. In fact, the top nine universities are private, and 14 of the top 15 are private. Only Miami University cracks the top 15.
Second, and more substantially, the mediocre-quality of students that enter teacher preparation programs stands out. Although average entrants into teacher preparation programs score marginally above the statewide average (23 versus 22 ACT composite), their scores don’t compete with the average Ohio State University entrant and are even less competitive with a prestigious university such as Case Western Reserve University. (Ohio State’s median composite score is 26 to 30; Case Western’s is 29 to 33.) In fact, only a few teacher preparation programs admit students near the caliber of the average Ohio State student.
The middling quality of students entering teacher preparation programs prompts questions: Why is this happening and what can be done to attract more talented teacher candidates? These are important questions, since they relate directly to the quality of Ohio’s future teaching force. Twenty-five or so states have already established fellowship programs aimed at improving the quality of its teaching force. North Carolina, for example, has a teaching fellows program that recruits and provides scholarships to 500 high school students who enroll in an in-state teacher preparation program. These scholarships are awarded based on academic merit. According to evaluative research, this program has successfully attracted higher-achieving students into teaching programs.
The data from the Regents demonstrate the need to attract high-achieving students into teaching. Ohio has slowly embraced Teach For America in Cincinnati, Cleveland, and Dayton, and it’s time to expand TFA. In addition, it may be time for Ohio to develop its own teaching fellowship program that attracts high-performing high school students into teaching programs. So, first hats off to the Regents for publishing these data, but now comes the hard part—acting on the data to improve the quality of teachers in the Buckeye State.
Postscript:
The National Council on Teacher Quality (NCTQ) released its 2012 State Teacher Policy Yearbook today. This report also indicates that admission standards to ed schools need to be raised. Ohio received C- on NCTQ's report card, just above the national average--a dismal D+. NCTQ rates states based on whether they have enacted policies that systematically prepare classroom-ready new teachers. One criteria is ed school admission standards.
[1] The Board of Regents does not report an admissions rate.
